

Executive summary
Understanding the drivers of Network Rail’s expenditure, including the reasons for changes over time is central to our work in assessing the scope for efficiency improvements. To achieve this, we use a range of complementary approaches including bottom-up assessments of Network Rail’s business plans and performance, and top-down cost benchmarking using statistical (econometric) methods. This report summarises our econometric benchmarking of Network Rail’s maintenance and renewals expenditure in the year from 1 April 2024 to 31 March 2025 (‘2024 to 2025’) and complements our Annual Efficiency and Finance Assessment of Network Rail.
Network Rail spent £6.3 billion on maintenance and on renewals activities in the most recent financial year, 2025 to 2026, together accounting for around 42% of Network Rail's total expenditure (£15.0 billion). Network Rail operates under a business model of five regions – Scotland, Eastern, Southern, Wales & Western and North West & Central. Within each region, Maintenance Delivery Units (MDUs) are responsible for the majority of routine maintenance activities, accounting for 57% of total maintenance expenditure. More complex activities such as examinations of structures and the overhaul of major plant are managed by regional teams (38% of expenditure), and around 5% by Network Rail’s central Route Services division.
Our analysis compares maintenance expenditure across Network Rail’s regions and across MDUs to identify where expenditure may be out of line with what would be expected after taking account of scale, usage and complexity. This provides a source for investigation of possible inefficiencies. For reasons of data quality and availability our benchmarking analysis uses 2024 to 2025 rather than 2025 to 2026.
Key findings
Key finding 1: Network Rail’s maintenance expenditure has increased substantially more over the past ten years than expected from changes in network scale, usage and complexity.
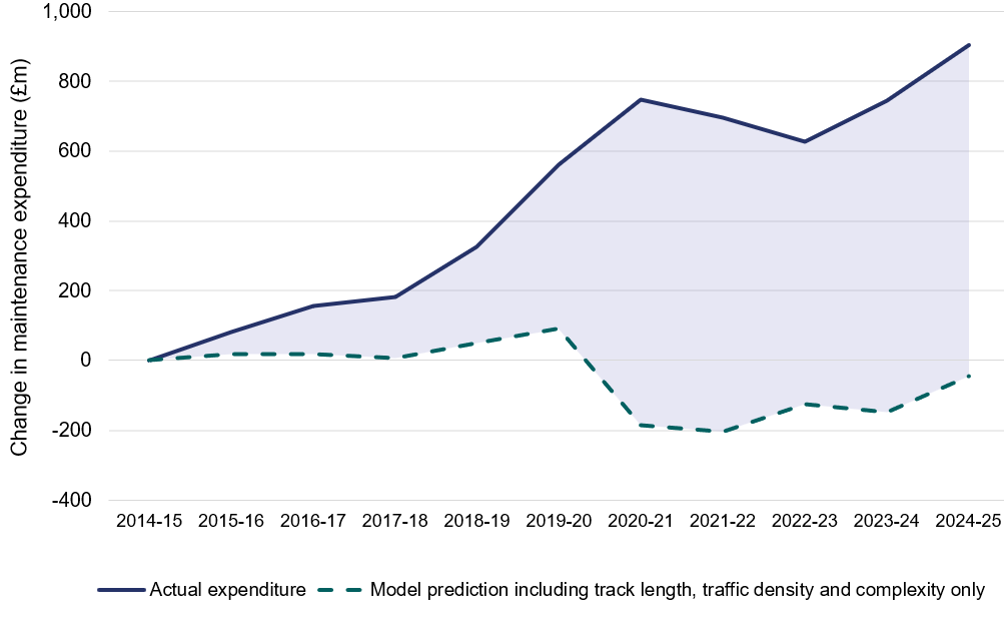
Adjusted for general inflation, maintenance expenditure increased by 56% to £2.5 billion over the ten years to 2024 to 2025. In contrast, our modelling, which adjusts for changes to scale, usage and complexity, predicted a small decrease in expenditure. The shaded area in Figure 1 represents the increase in maintenance expenditure that cannot be explained by changes in track length, traffic density and network complexity or general price inflation (as measured by CPI).
Several factors may have contributed to maintenance expenditure increasing by more than our modelling predicts. These include a switch in asset management strategies from renewals to maintenance, initiatives to improve track worker safety and vegetation management, and input prices above general inflation. For our comparative analysis of regions and MDUs in this report, our modelling used dummy variables to account for the changes in costs over time not explained by scale, usage and complexity. This allows our analysis to focus on the relative performance of regions and MDUs.
Figure 1: Actual and predicted changes in maintenance expenditure since 2014
Note: Predicted and actual maintenance expenditure is in 2024 to 2025 prices and has been adjusted for inflation
The changes in predicted expenditure shown in Figure 1 are mostly due to changes to usage which includes the significant disruption from Covid-19. However, there have also been changes to complexity and scale data. For example, the primary complexity variable in our modelling increased by 11% over this period, and track length reduced by 0.5%.
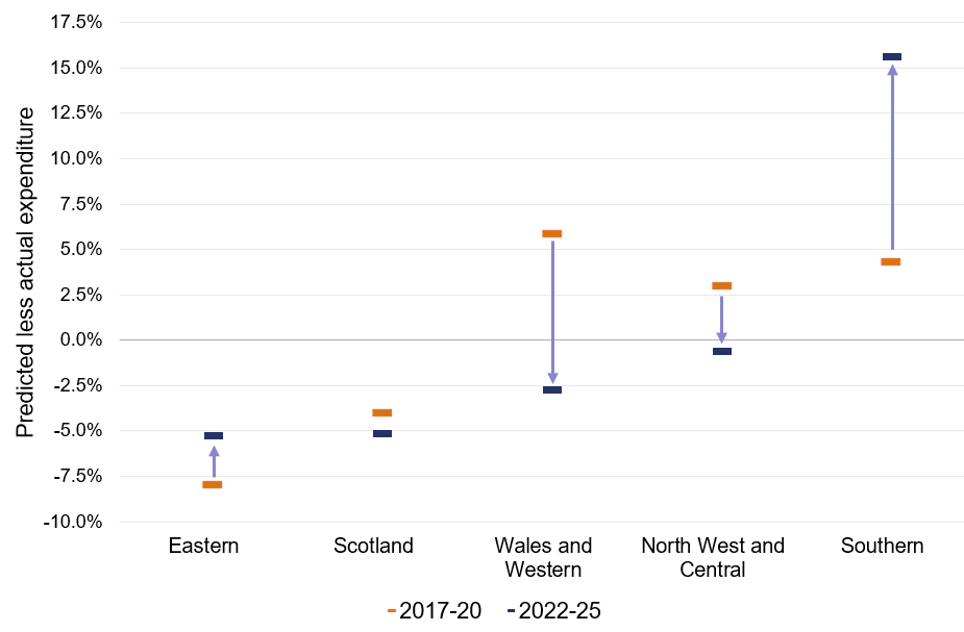
Key finding 2: Southern region has become an increasing outlier, with expenditure increasing compared to our model predictions relative to other regions over the past five years.
Regions’ maintenance expenditure ranged from 15.6% higher for Southern to 5.3% lower than predicted for Eastern. As shown in Figure 2, variances to our model predictions have largely reduced over the past five years, with only Southern showing a significant deterioration. This may partly reflect Southern making greater use of contractors, which can increase maintenance costs.
Figure 2: Regions’ actual and predicted maintenance expenditure
Note: A negative number means that a region spent less than our model predicted and vice versa.
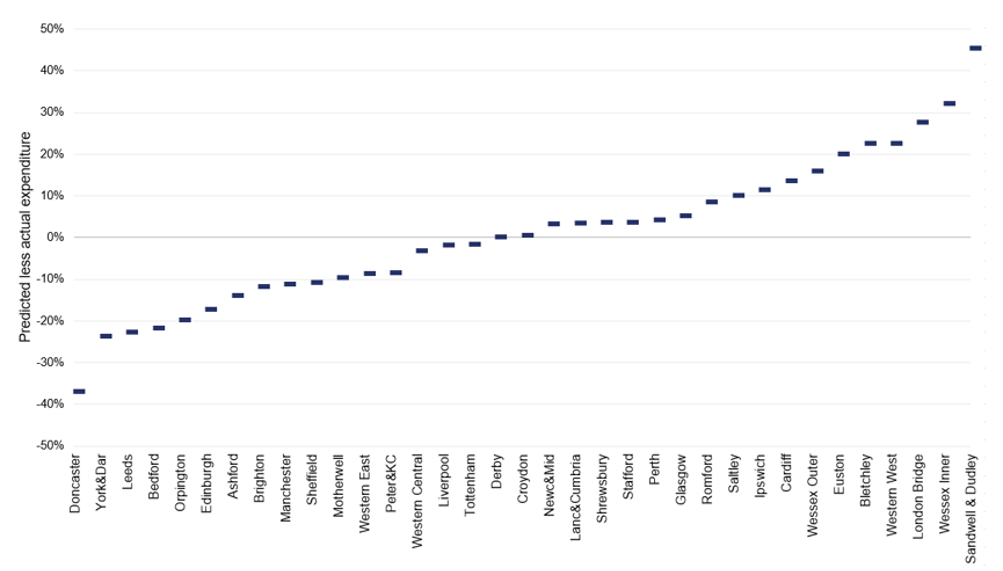
Key finding 3: There are substantial variations between predicted and actual MDU expenditure. Indicative savings could be £120 million per year if MDUs with expenditure above our model prediction were brought in line with their predicted expenditure.
As shown in Figure 3, maintenance expenditure ranged from 36.9% below to 45.4% above our model prediction across MDUs. By way of illustration, If MDUs with expenditure above our model prediction were brought in line with predicted expenditure, Network Rail could potentially save around £120 million per year, equivalent to 5.0% of annual maintenance expenditure. However, this quantum of potential savings should be treated with caution and our report should not be taken as recommending a change to specific targets at this time. Some of the differences between MDU predicted and actual expenditure may reflect cost saving opportunities, however it may also reflect MDU specific factors not captured by the model. To understand these factors would require further work. It would also be important to better understand the interplay with the renewals strategy, practicable changes in working practices and the phasing of changes. Rather, our report identifies that the relative performance of MDUs is an area where we recommend that Network Rail, and in future GBR, should be focussing attention.
Figure 3: MDUs’ actual and predicted maintenance expenditure, 2022-25
Note: A negative number means that an MDU spent less than our model predicted and vice versa.
Renewals expenditure
In previous reports we have published econometric benchmarking of regions’ track renewals expenditure. In our analysis for this year’s report, we have found some evidence of economies of scale for track renewal, with lower unit costs where there are higher volumes for both full and partial plain line track renewal. However, as explained in Chapter 3, we have used a different unit cost dataset this year and the statistical robustness of our findings was not considered sufficient to make benchmarking conclusions with confidence across the Network Rail regions. We will continue to work with Network Rail to improve our understanding of which explanatory variables are most useful and available to use for benchmarking of renewals expenditure.
We also have concerns about irregularities in some of the data provided by Network Rail that underpins our analysis. We have sought to correct our analysis where possible for these irregularities. The technical annex supporting this report explains these matters further.