

1.1 Network Rail operates under a business model of five devolved regions. These are Eastern, North West & Central, Scotland, Southern, and Wales & Western. This chapter summarises our maintenance cost benchmarking of these regions.
Regional maintenance unit cost benchmarking
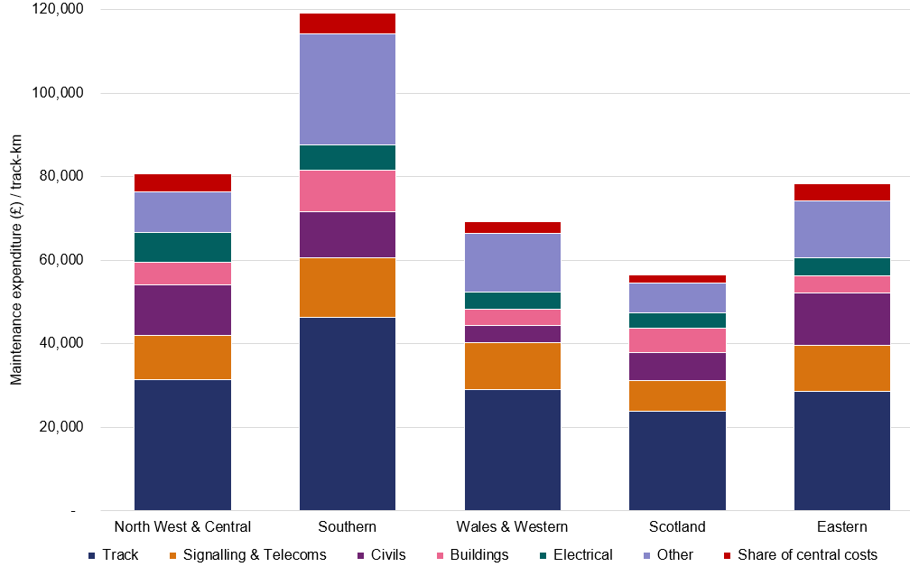
1.2 Figure 4 shows maintenance expenditure per track-km (‘unit cost’) across regions. Southern had a significantly higher maintenance expenditure per track-km than other regions across most asset categories, and Scotland the lowest. Track maintenance represents the largest share of expenditure across all regions. Differences in signalling, civils and ‘other’ costs also contribute to the observed variation across regions.
Figure 4: Breakdown of regional maintenance expenditure per track length, 2024 to 25
Source: ORR analysis of Network Rail data
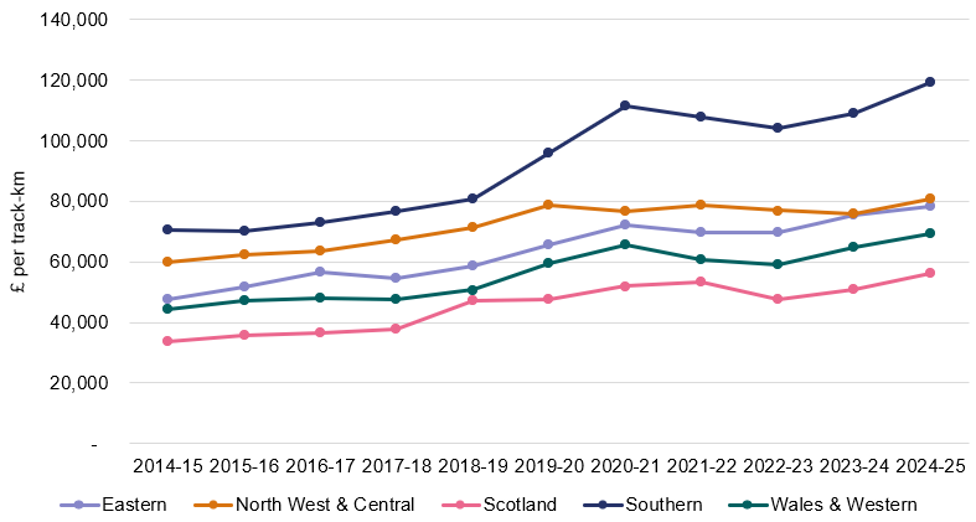
1.3 As shown in Figure 5, adjusted for inflation, maintenance expenditure per track-km has increased across all regions over the past ten years, with the largest increases in Southern and Wales & Western. The pattern is relatively steady over time, rather than being driven by a small number of isolated years.
1.4 Although maintenance expenditure per track-km increased in Wales & Western, as examined later in this chapter, the region's expenditure relative to our model prediction improved over time. This is because the benchmarking model accounts for factors such as usage and network complexity, which are not captured by the simple expenditure per track-km metric. As a result, increases in expenditure per track-km do not necessarily correspond to deteriorating relative performance.
1.5 The relatively steady increases shown in Figure 5 also suggest that the growth in maintenance expenditure is not primarily the result of short-term lumpiness in annual spending but instead reflects a broader upward trend in regional maintenance costs.
Figure 5: Regions’ maintenance expenditure per track-km
Note: Total maintenance expenditure is in 2024 to 2025 prices and has been adjusted for inflation
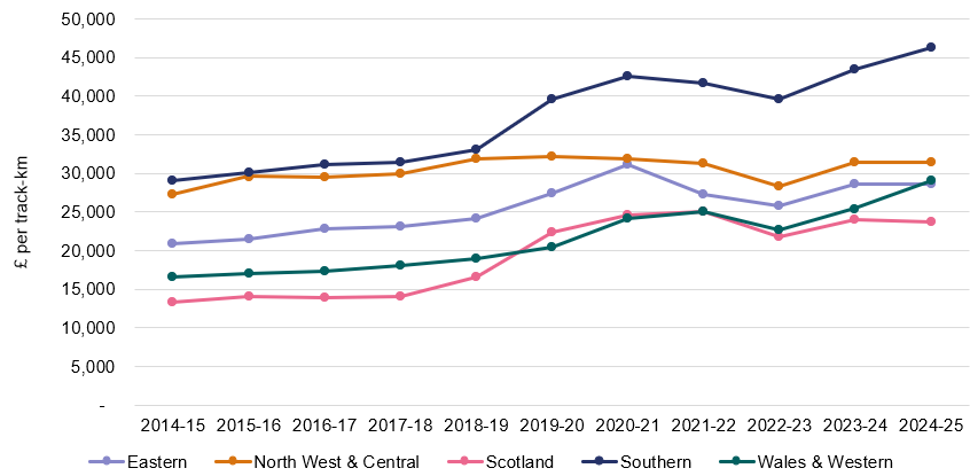
1.6 As shown in Figure 6, track maintenance cost per track-km increased for all regions over the past ten years. However, the scale of increase is lower than for total maintenance expenditure. This shows that track maintenance has not been the primary driver of regions’ increased maintenance costs over the past ten years. Southern’s track maintenance expenditure per km increased substantially more than the other regions.
Figure 6: Regions’ track maintenance expenditure per track-km
Note: Track maintenance expenditure is in 2024 to 2025 prices and has been adjusted for inflation
1.7 Differences in maintenance expenditure per track-km alone do not provide a reliable indication of relative expenditure performance across regions. Maintenance costs will also vary with, amongst other things, higher usage (for example, due to more wear and tear), and network complexity (for example, due to the need to maintain more switches and crossings). As explained in the technical report, our cost benchmarking controls for these key cost drivers, to predict each region’s maintenance expenditure (we also include year effects in our model to control for network-wide changes in maintenance expenditure over time, such as inflationary effects above CPI (‘input prices’), and other factors affecting all regions).
Regional model results
1.8 Our regional benchmarking model includes scale, usage and complexity variables. We compare our model predictions to regions’ actual expenditure to identify variances for follow-up investigation about the scope for cost reductions.
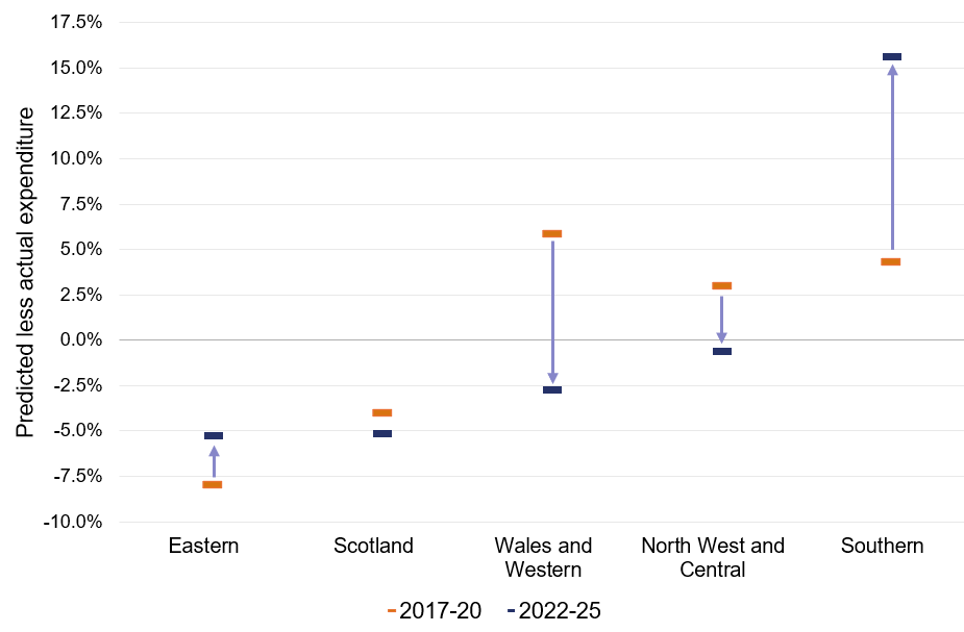
1.9 Figure 7 shows the proportion of unexplained variance in maintenance expenditure for each region. We used a three-year average to mitigate data quality concerns outlined in the ‘Data issues’ section. A negative number means that a region spent less than our model predicted and vice versa.
1.10 Figure 7 shows regions’ maintenance expenditure ranged from 5.3% lower than predicted for Eastern to 15.6% higher for Southern. Figure 7 also shows how these variances have changed over time, with Southern showing the largest deterioration and Wales & Western showing the greatest improvement. These variations may reflect regions’ different approaches for targeting maintenance activities, differences in the degree of mitigation required for changes to regions’ planned renewals activities and differences in efficiency. Southern was the largest outlier, while Eastern and Scotland spent less than our model predicted.
Figure 7: Regions’ actual and predicted maintenance expenditure
1.11 Another way of representing regions’ expenditure performance is to calculate the ratio of each region’s actual expenditure divided by the model predicted expenditure. A ratio of above one means that a region has spent more than predicted, and a ratio of below one means that a region has spent less than predicted.
Table 1: Relative regional expenditure compared to model prediction
| Region | 2018 to 2021 | 2019 to 2022 | 2020 to 2023 | 2021 to 2024 | 2022 to 2025 |
|---|---|---|---|---|---|
| Eastern | 0.94 | 0.99 | 0.99 | 0.98 | 0.95 |
| North West & Central | 0.98 | 0.98 | 0.98 | 1.02 | 0.99 |
| Scotland | 0.99 | 0.97 | 0.97 | 0.95 | 0.95 |
| Southern | 1.04 | 1.06 | 1.09 | 1.11 | 1.16 |
| Wales & Western | 1.05 | 1.01 | 0.98 | 0.95 | 0.97 |
1.12 Table 1 shows rolling three-year average expenditure relative to model predictions from 2018 to 2019 to 2024 to 2025. The results provide a smoothed view of expenditure performance over time, reducing the influence of year-to-year fluctuations in Network Rail's expenditure data. Southern consistently spent more than our model predicted and its relative expenditure increased over the period. In contrast, Eastern and Scotland consistently spent less than our model predicted.