

2.1 Maintenance Delivery Units (MDUs) manage most routine maintenance activities within Network Rail’s regions, accounting for 57% of Network Rail’s total maintenance expenditure. MDUs maintain networks of different sizes with different levels of use and complexity.
2.2 Our MDU cost benchmarking analysis controls for scale, usage and complexity to predict each MDU’s maintenance expenditure:
- Track length to account for network scale;
- Passenger and freight traffic density to account for network usage; and
- Criticality, track electrification and density of switches and crossings to account for network complexity.
2.3 We account for expenditure changes associated with the disruption caused by Covid-19. Further information on the model and statistical tests applied are available in the technical report supporting this report.
2.4 We compare each MDU’s actual expenditure with the expenditure predicted by our model. This helps us identify the MDUs where expenditure is materially higher or lower than expected, given the characteristics of the network they maintain. These results identify areas for further investigation.
2.5 During our analysis we encountered some data irregularities. These issues and mitigations are explained in the final section of this chapter. Further discussion of our approach to managing the data issues are included in our technical report
MDU unit cost benchmarking
2.6 Figure 8 shows maintenance expenditure per track kilometre for each MDU in 2024 to 2025, and in 2014 to 2015.
Figure 8: Maintenance cost per track km (2024 to 2025 prices)
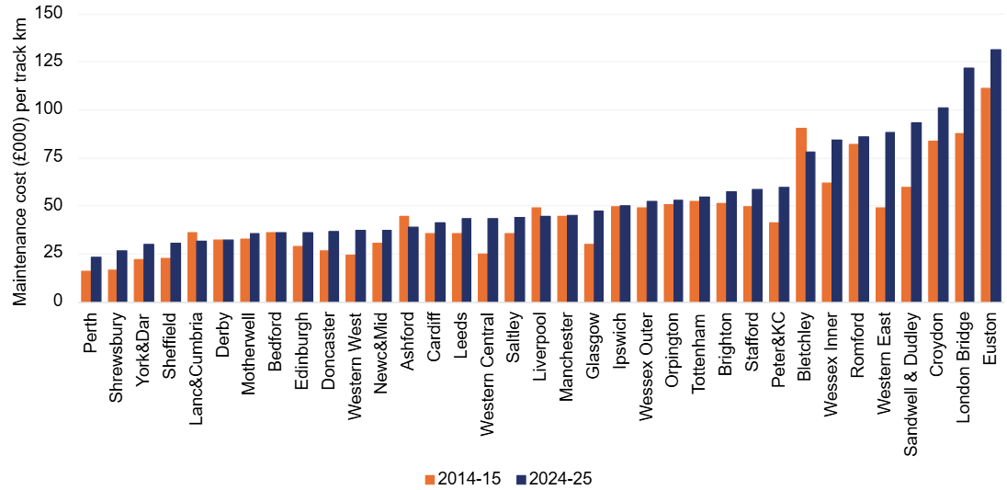
2.7 As shown in Figure 8, maintenance expenditure per track-km varies substantially between MDUs. In 2024 to 2025, Euston’s expenditure was more than five times higher than Perth MDU. Large differences in expenditure per track-km were also evident in 2014 to 2015 and persisted across the past ten years.
2.8 On average, MDU expenditure per track-km increased by 23% between 2024 to 2025 and 2024 to 2025. Western East MDU had the largest increase at 79%.
2.9 However, expenditure per track-km does not take account of how intensively each network is used or how complex it is to maintain. A relatively high cost per track-km may be expected for an MDU operating a busy and complex part of the network. As MDUs have more distinct characteristics, the impact of traffic and complexity will be greater on the costs of MDUs than regions. We therefore use econometric cost benchmarking, which controls for scale, usage and complexity, to make a more like-for-like comparison.
MDU model results
2.10 Figure 9 shows the proportion of unexplained variance in maintenance expenditure for each MDU. We used a three-year average to mitigate irregularities in Network Rail’s data.
Figure 9: MDUs’ actual and predicted maintenance expenditure
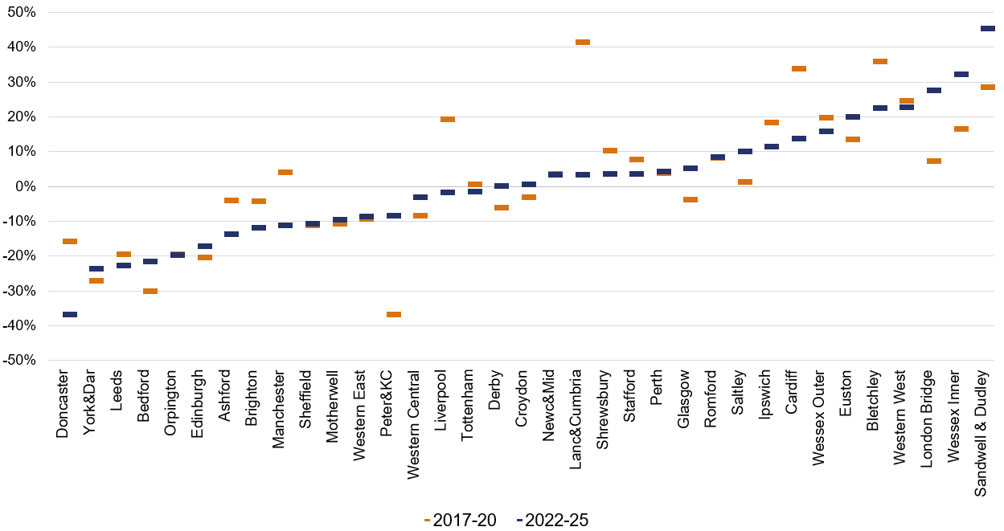
Note: A negative number means that an MDU spent less than our model predicted and vice versa.
2.11 Figure 9 shows the variation in maintenance expenditure for MDUs ranged between -37% (Doncaster MDU) and +45% (Sandwell and Dudley MDU) compared with our model predictions.
2.12 For some MDUs, there have been substantial changes in the variation between actual and predicted expenditure over the past five years. For example, Lancs & Cumbria’s variation in maintenance expenditure has reduced by 38 percentage points, while Peter&KC’s has increased by 28 percentage points.
2.13 If MDUs whose expenditure is above the model prediction were brought into line with predicted expenditure, our analysis indicates that Network Rail could save around £120 million per year. This is equivalent to around 5% of Network Rail’s annual maintenance expenditure. However, this quantum of potential savings should be treated with caution and our report should not be taken as recommending a change to specific targets at this time. Some of the differences between MDU predicted and actual expenditure may reflect cost saving opportunities, however it may also reflect MDU specific factors not captured by the model. To do so would require further work. It would also be important to better understand the interplay with the renewals strategy, practicable changes in working practices and the phasing of changes.
Figure 10: Selected MDUs’ actual and predicted maintenance expenditure
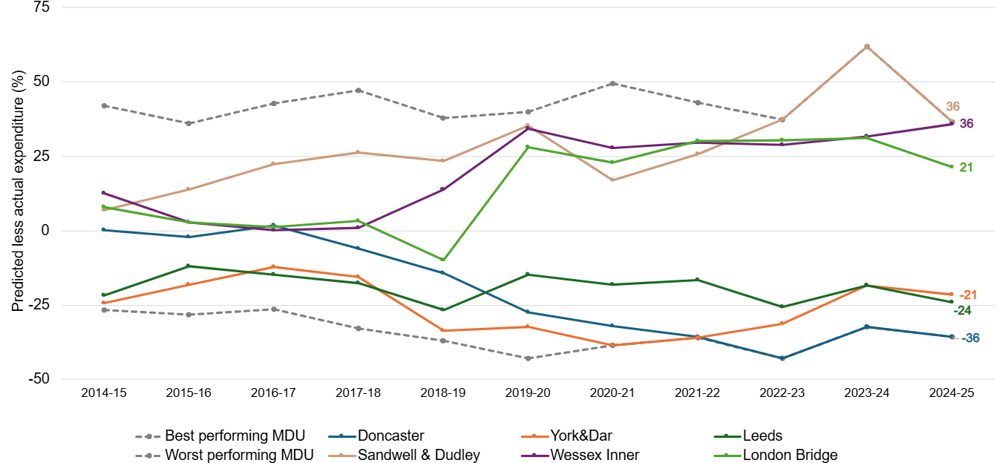
Note: A negative number means that an MDU spent less than our model predicted and vice versa.
2.14 Figure 10 shows the variation between actual and predicted maintenance expenditure for six selected MDUs between 2014 to 2015 and 2024 to 2025. These MDUs were the three best (Doncaster, York&Dar and Leeds) and three worst (Sandwell and Dudley, Wessex Inner and London Bridge) relative performers in 2024 to 2025.
2.15 The relative performance of Doncaster has improved over time, while the performance of Leeds and York&Dar changed little over the last ten years. In contrast, the performance of Sandwell and Dudley, Wessex Inner and London Bridge have all declined over time (shown by an increasing trend on the chart). This suggests that changes in costs over time may be more important in explaining differences in MDU performance than factors unique to individual MDUs.
2.16 Overall, the relative performance of the best and worst performing MDUs is little changed over the last ten years, with the range changing from 69% to 72%.
2.17 Our analysis provides areas for further investigation of possible productivity gains, for example, through ways of working and technology adoption of higher performing MDUs. We have discussed our findings with Network Rail for further exploration.
2.18 We have compared our economeric benchmarking model to the simple maintenance cost per track-km to identify the wider impact of usage and complexity on MDU expenditure. The difference between MDUs’ relative performance in Figures 8 and 9 illustrates the importance of usage and network complexity in understanding MDUs’ expected expenditure, i.e. that network scale is not the only important driver of MDUs’ maintenance expenditure.
2.19 Table 2 shows that for two selected MDUs (Western West and Croydon), the maintenance cost per track is markedly different to the expenditure ratio rank. As an example, Western West is a larger but lesser used part of the network and has a middle-ranking maintenance cost per track km. Our model takes account of scale, usage and complexity. Our analysis shows that Western West’s expenditure is substantially higher than predicted given its characteristics. For Croydon MDU, the opposite is the case. Croydon MDU covers a small proportion of the network but is a highly used and complex part of the network. It has one of the highest-ranking maintenance costs per track km, however, its expenditure is consistent with our model prediction taking account of scale, usage and network complexity.
Table 2: Selected MDUs maintenance cost per track km and rank for characteristic variables, 2024 to 2025
| MDU | Maintenance cost per track km rank (1st = lowest) | Expenditure ratio rank (1st = best) | Passenger km density rank | Electrified track km density rank | Switches and crossings density rank | ||
| Western West | 11th | 33rd | 31st | 34th | 33rd | ||
| Croydon | 33rd | 23rd | 2nd | 1st | 2nd | ||
Data issues
2.20 Our analysis has had to deal with several problems with the data provided by Network Rail. The most significant of these was that three new MDUs (Darlington, Kings Cross and Middlesbrough) were created out of the York, Peterborough and Newcastle MDUs in 2020 to 2021. The creation of the new MDUs also changed the boundaries of the existing MDUs. To address these boundary problems we combined the three new MDUs with the three existing MDUs to create larger composite MDUs:
- Newcastle was combined with Middlesborough to become Newc&Mid;
- Peterborough was combined with King’s Cross to become Peter&KC; and
- York was combined with Darlington to become York&Dar.
2.21 To mitigate our concerns with Network Rail’s data, we normalised the network characteristics data so that these were consistent pre- and post-boundary change. We also used three-year averages to construct our econometric benchmarks. More detail is provided in our technical report.
2.22 Network Rail considers that its data is robust. In response to our concerns about the quality of their data, Network Rail stated that discrepancies arise between the cost benchmarking dataset and other datasets supplied to the ORR because each dataset is produced using different methodologies and for different purposes. We do not consider that these matters undermine the usefulness of the analysis presented in this report.