

3.1 Renewals relate to activities to replace, in whole or in part, network assets that have deteriorated such that they can no longer be maintained economically. Renewal of an asset restores the original performance of the asset and can add additional functionality as technology improves.
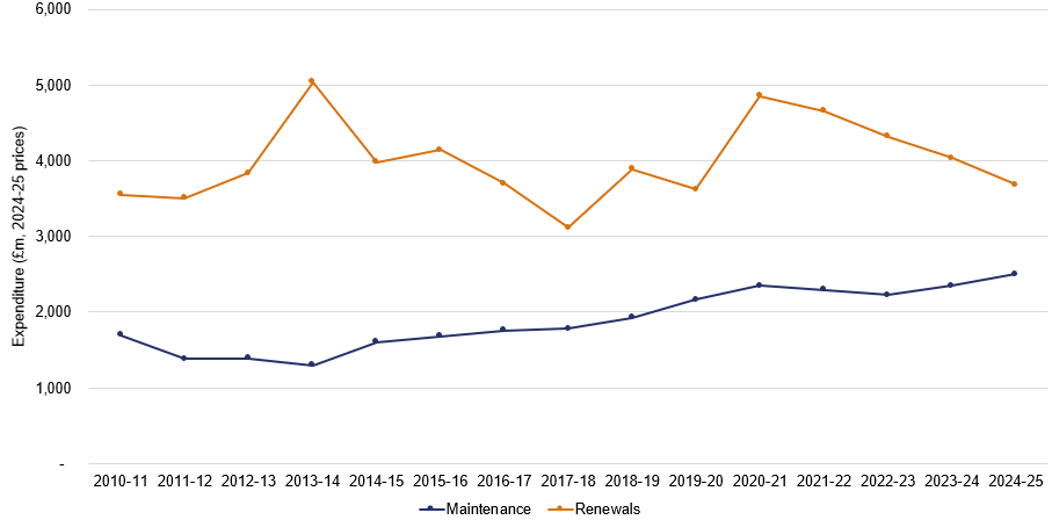
3.2 Figure 11 shows how maintenance and renewals expenditure have changed between 2010 to 2011 to 2024 to 2025.
Figure 11: Network Rail’s maintenance and renewals expenditure
Source: ORR analysis of Network Rail data
3.3 As shown in Figure 11, over the past five years there has been a steady decrease in renewals expenditure as Network Rail has reduced expenditure in line with the available funding. Over the same period, maintenance expenditure has increased partly due to the need for increased maintenance in lieu of reduced renewals. The relationship between maintenance and renewals expenditure in the ten years prior to this is less clear, largely due to the uneven annual profile of renewals expenditure.
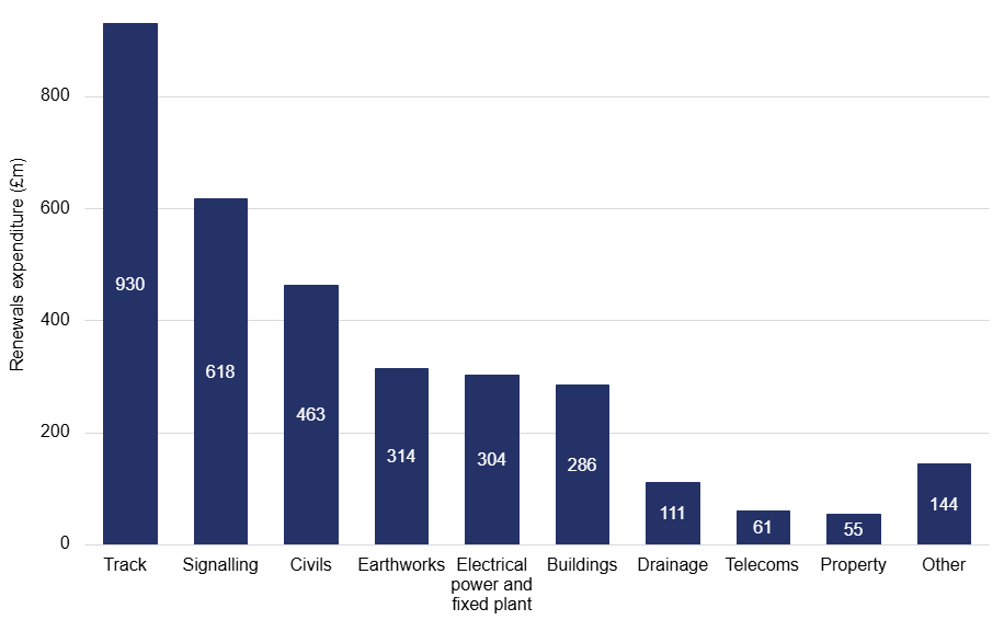
Figure 12: Combined regional renewals expenditure by asset class, 2024 to 2025
Source: ORR analysis of Network Rail data
3.4 Figure 12 shows Network Rail renewals expenditure by asset class in 2024 to 2025. Track was the largest category of renewals expenditure. It comprises full plain line track renewal (28%), partial plain line track renewal (28%), switches and crossings (30%), and refurbishment and other track renewals (13%).
3.5 Our previous renewals benchmarking analysis used a bespoke dataset that did not differentiate between full and partial plain line track renewals. However, full and partial renewals involve different activities with different associated costs. Combining full and partial renewals can lead to misleading benchmarking results, for example, if regions undertake a different mix of full and partial renewals.
3.6 This year we have used a different dataset based on information in Network Rail’s Regulatory Financial Statements to separately analyse full and partial plain line track renewal unit costs. Full and partial plain line track renewals are reported separately in Network Rail’s Regulatory Financial Statements from 2019 to 2020 onwards. This improves comparability between regions as we can distinguish between full and partial plain line track renewal activities.
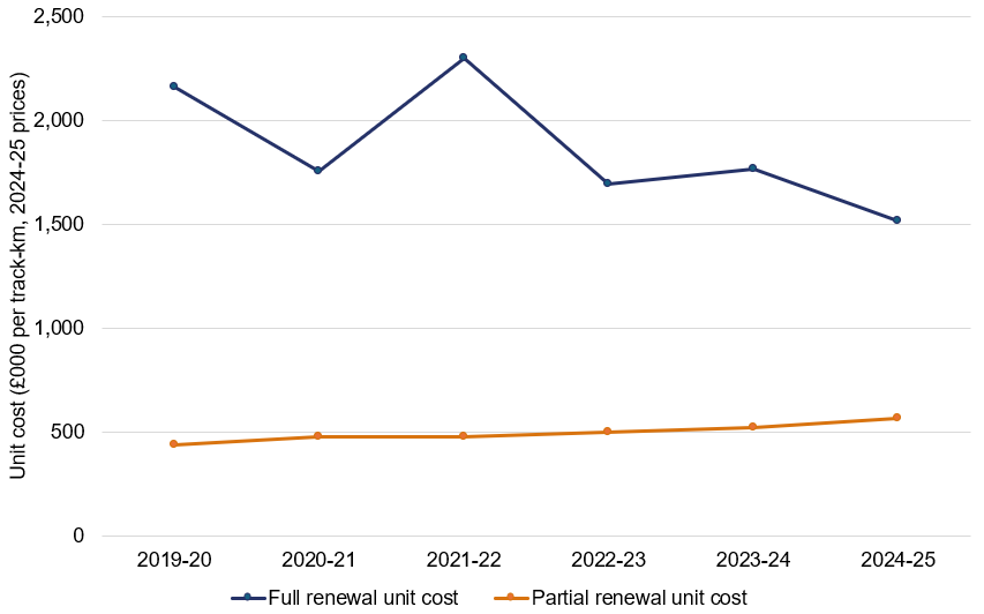
Figure 13: Unit costs for full and partial plain line track renewals
Source: ORR analysis of Network Rail data
3.7 As shown by Figure 13, full plain line renewals have consistently higher unit costs than partial renewals. Over the period, full renewal unit costs ranged between around £1.5 million and £2.3 million per km, compared with around £0.4 million to £0.6 million per km for partial renewals. Full renewal unit costs were also considerably more volatile from year to year. This pattern is consistent with the lumpy nature of full renewals programmes and fluctuations in annual delivery volumes.
Track renewals unit cost analysis
3.8 Our analysis has found evidence of economies of scale for both full and partial plain line track renewals. This means that a higher volume of work undertaken by a region in a year is usually associated with a lower cost for each unit of work (renewal of a kilometre of track).
Full plain line track renewals
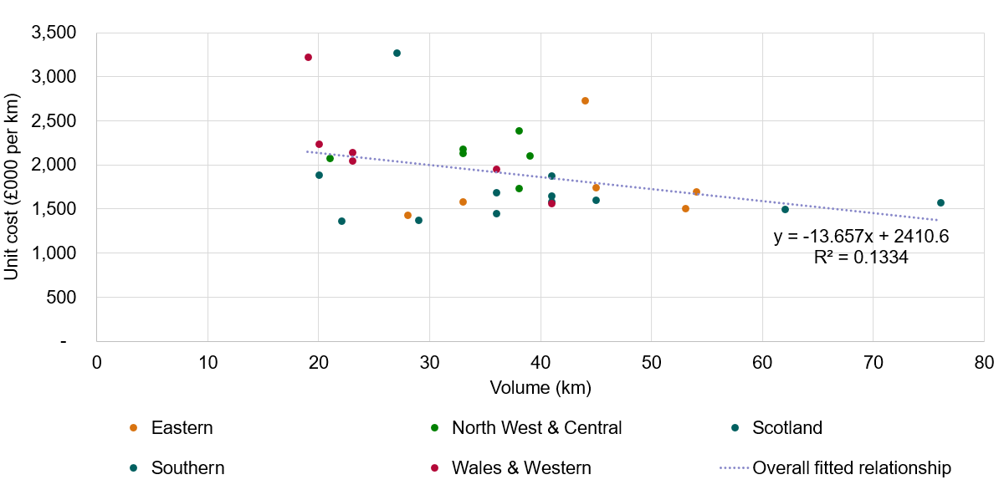
3.9 Figure 14 shows that unit costs fall as full plain line track renewal volumes increase, for example, a 10% increase in volume results in a 2.6% decrease in the unit cost. This is evidence of economies of scale. However, the relationship is weak, with volume explaining only around 13% of the variation in unit costs. This means that our finding of economies of scale for full plain line track renewal should be interpreted cautiously.
Figure 14: Relationship between full plain line track renewal volumes and unit costs, 2019 to 2020 to 2024 to 2025
Source: ORR analysis of Network Rail data
Partial plain line track renewals
3.10 Figure 15 shows that higher volumes of partial plain line track renewals are generally associated with lower unit costs. For example, a 10% increase in volume results in a 3.4% decrease in unit cost. This relationship is more robust than for full renewals, with volume explaining around 44% of the variation in observed unit costs.
Figure 15: Relationship between partial plain line track renewal volumes and unit costs, 2019 to 2020 to 2024 to 2025
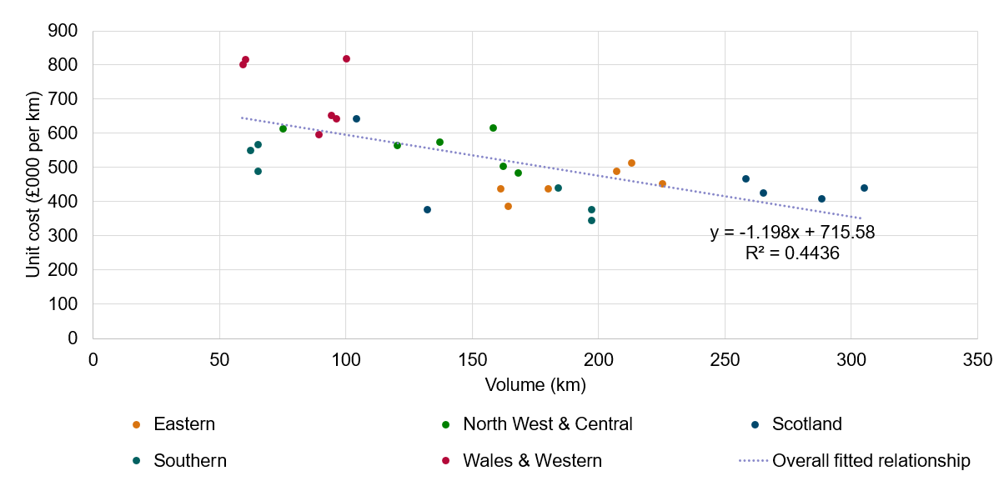
3.11 Figures 14 and 15 show that volumes and unit costs for plain line track renewals vary across regions. The relationship between volumes and unit costs is clearer for partial plain line track renewals than for full. However, there remains substantial variation around the relationships. We therefore do not consider that the results are sufficiently robust to support strong regional benchmarking conclusions.
3.12 Despite finding some evidence for economies of scale, we were unable to develop robust econometric modelling of predicted unit costs for regions including wider explanatory variables. We tested a range of explanatory variables including scale, usage and complexity variables, and used different statistical models, however, with only a limited available sample size. None of the models that we investigated produced reliable results. We will continue to work with Network Rail to improve our understanding of which explanatory variables may be useful and available to use for modelling of renewals expenditure.