

3.1 In our main report, we described the issues that we encountered with the data that was provided by Network Rail. These irregularities were found in the MDU data. This impacts both the regional and MDU analysis because MDU characteristic data are aggregated to region-level. We have provided more detail below.
New MDUs
3.2 Three new MDUs (Darlington, Kings Cross and Middlesbrough) were created from three existing MDUs (York, Peterborough and Newcastle) in 2020-21. However, the three new MDUs were not fully operational until 2021-22.
3.3 As MDUs must be operational for a full financial year before reliable expenditure data can be collected, maintenance expenditure data was only available from 2022 to 2023 onwards. The creation of the new MDUs changed the boundaries of the existing MDUs. However, the allocation of expenditure data was not affected and remained consistent across the period.
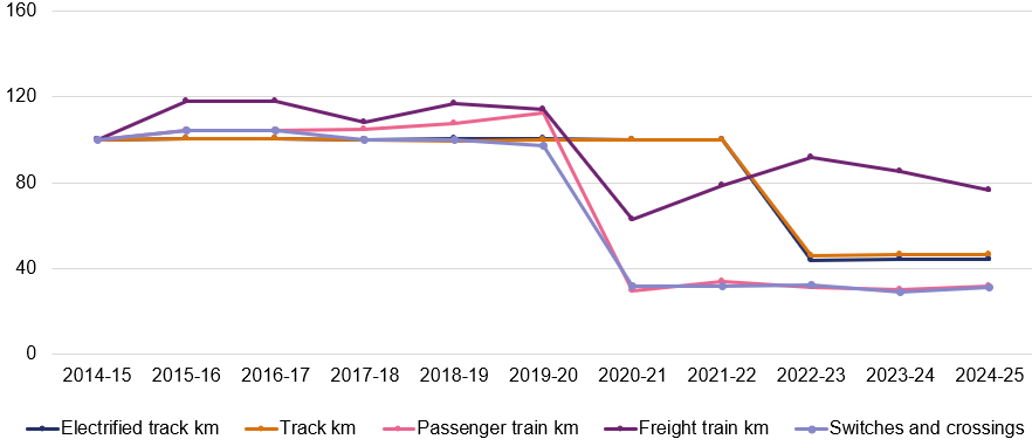
3.4 The MDUs’ network characteristics data was not reported consistently. Figure 1 shows that for Peterborough MDU, passenger and freight train km and switches and crossings data was reallocated to the new MDUs in 2020 to 2021. In contrast, track km and electrified track km was reallocated in 2022 to 2023. This led to irregularities in the estimated relationships between maintenance expenditure and the explanatory variable.
Figure 1: Index of network characteristics for Peterborough MDU (2014 to 2015 = 100)
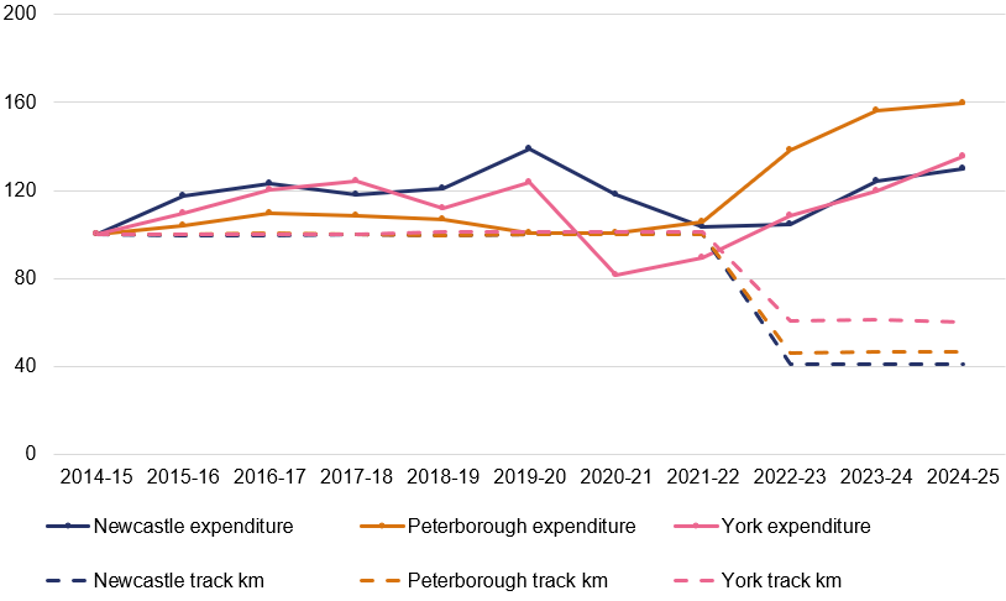
3.5 Figure 2 shows the maintenance expenditure of the three existing MDUs increased while their length of track fell. This is because some track previously attributed to York, Peterborough and Newcastle MDUs became part of Darlington, Kings Cross and Middlesbrough MDUs respectively, but their maintenance expenditure was unchanged. It is unclear why the maintenance expenditure was not affected by this boundary change and as such, the three existing MDUs would appear less efficient compared to before 2020 to 2021.
Figure 2: Index of maintenance expenditure adjusted for inflation and track km for the three affected existing MDUs (2014 to 2015 =100)
3.6 We combined the three new MDUs with the three existing MDUs to create larger composite MDUs. Where network characteristics data was only available from 2022 to 2023, we fixed data to the first year with full coverage post-boundary change and applied this consistently across earlier years with missing data. This approach ensured consistency where characteristics data reflected boundary changes at different points in time across variables. Table 6 shows that the composite MDUs’ network characteristics approximately equal that of the existing MDUs before the boundary change, for example, the combined track length of the Newcastle and Middlesborough MDUs was 1,021km in 2021 to 2022, and the track length of Newc. and Mid. was 1,018 km in 2022 to 2023.
Table 6: Selected variables for the new MDUs and the MDUs affected by the boundary change
Track km | Track km | Track km | Switches and crossings density | Switches and crossings density | Switches and crossings density | ||||||||||
|---|---|---|---|---|---|---|---|---|---|---|---|---|---|---|---|
2021-22 | 2022-23 | 2023-24 | 2021-22 | 2022-23 | 2023-24 | ||||||||||
Newcastle | 1021 | 419 | 416 | 551 | 279 | 274 | |||||||||
Middlesbrough | 0 | 599 | 599 | 0 | 241 | 238 | |||||||||
Newc. and Mid. | 1021 | 1018 | 1015 | 551 | 520 | 512 | |||||||||
Peterborough | 815 | 376 | 380 | 474 | 156 | 142 | |||||||||
Kings Cross | 0 | 439 | 435 | 0 | 297 | 295 | |||||||||
Peter. and K.C. | 815 | 815 | 815 | 474 | 453 | 437 | |||||||||
York | 1288 | 776 | 782 | 556 | 316 | 310 | |||||||||
Darlington | 0 | 509 | 487 | 0 | 202 | 201 | |||||||||
York and Dar. | 1288 | 1285 | 1269 | 556 | 518 | 511 | |||||||||
3.7 The three new MDUs were not included in last year’s results although the data issues described also affected last year’s results. As such, the findings in last year’s report are not directly comparable with our results presented in our main report and should be interpreted with caution.
Usage data issues
3.8 In 2024 to 2025, total passenger train distance travelled increased by 9.0%, primarily due to continued recovery from Covid-19 disruption. However, based on Network Rail’s reported data, there were significant variances for individual MDUs, with 16 MDUs having a greater than 10 percentage point difference to the national passenger train km growth rate. For example, passenger train km for the Shrewsbury MDU increased by 41% and Derby MDU decreased by 23%. Network Rail has stated that this data is accurate.
Criticality data issues
3.9 We observed several step changes in the criticality data throughout the time series. For example, Western West MDU’s ‘criticality 2’ track length was 248km in 2017 to 2018, dropped to 151km in 2018 to 2019 and rose to 292km in 2019 to 2020. Network Rail has assured us that these data are accurate and that reclassifications can occur for legitimate business reasons. To reduce the impact of these discontinuities on our modelling, we normalised unusual looking criticality data and used three-year averages when presenting benchmarking results.
Hosting
3.10 Some MDUs undertake maintenance activities on behalf of another, but the associated costs are not consistently reallocated. This is referred to as ‘hosting.’ We have discussed this issue with Network Rail in relation to this year’s data, however, Network Rail has not advised which MDUs are impacted by hosting. We have therefore been unable to account for hosting in our analysis. This may contribute to differences in costs between MDUs within the same regions.
Renewals analysis
3.11 Despite finding evidence for economies of scale, we were unable to develop robust econometric modelling of predicted unit costs for regions. We tested a range of explanatory variables including scale, usage and complexity variables, and used different statistical models. However, none of the models produced reliable results. We will continue to work with Network Rail to improve our understanding of which explanatory variables may be useful and available to use for modelling of renewals expenditure.