

Traffic volume
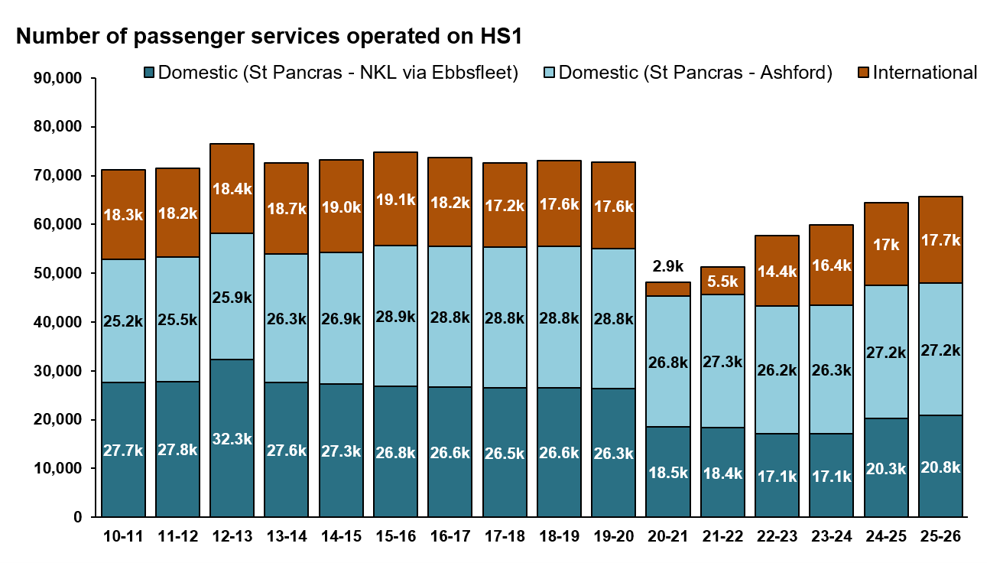
The total number of trains timetabled on HS1 from 1 April 2025 to 31 March 2026 was 65,734. This is a 1.5% increase compared to the 64,776 in the previous year, and still 10% lower than the 73,076 in the period 1 April 2019 to 31 March 2020 (the year before the COVID-19 pandemic).
International services increased by 4% in the latest year (to 17,746) compared to the previous year (17,017), bringing them to 1% above the number of services operated in the year before the pandemic (17,594). However, the domestic Southeastern North Kent Line (NKL) services in the latest year (20,837) were 21% below the number operated in the year before the pandemic (26,324).
London St. Pancras Highspeed’s (LSPH’s) Concession Agreement requires it to report on disruption as a percentage of the trains timetabled, rather than a percentage of actual trains run, which is reflected in our reporting below.
Please note that some of the figures for train delays in this chapter may be subject to revision due to the normal, ongoing process of delay attribution.
Figure 2.1 Number of passenger train services timetabled on HS1, 1 April 2010 to 31 March 2026
Source: London St. Pancras Highspeed Performance Floor Report
Freight trains ceased running on HS1 in July 2024 and as a result, the number of freight train services run on HS1 in the latest year was zero.
Train service performance
We monitor two measures of train service performance. Firstly, LSPH submits to us quarterly and annual performance floor reports demonstrating its operational performance against minimum thresholds set out in its Concession Agreement. These state that the proportion of services delayed by LSPH in a quarter should not exceed 15%, and in a year must not exceed 13%.
However, both LSPH and its users expect much higher levels of performance than this. As a result, LSPH sets itself and its subcontractor Network Rail High Speed a separate, more stretching, target, which we also monitor.
Performance against minimum threshold
Table 2.1 shows a breakdown of performance for the year ending 31 March 2026.
Table 2.1 HS1 train service performance: 1 April 2025 – 31 March 2026
| Service type | Total number of trains timetabled | Total number of delayed trains (attributed to HS1) | Delayed trains (attributed to HS1) as a percentage of timetabled trains | Total number of delayed trains (unknown cause) |
|---|---|---|---|---|
| Domestic (London St. Pancras – North Kent Line via Ebbsfleet International) | 20,837 | 70 | 0.34% | 11 |
| Domestic (London St. Pancras – Ashford International) | 27,151 | 140 | 0.52% | 24 |
| International | 17,746 | 95 | 0.54% | 24 |
| Freight | 0 | 0 | 0.00% | 0 |
| Total | 65,734 | 305 | 0.46% | 59 |
Source: London St. Pancras Highspeed Performance Floor Report
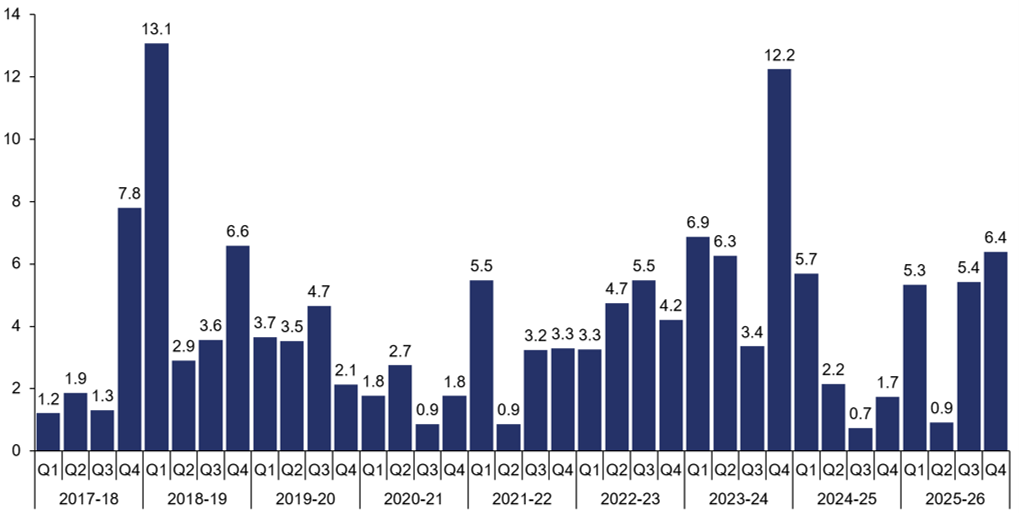
The proportion of trains delayed by LSPH-attributable incidents in the latest year was well within the allowable standards set out in the Concession Agreement (13%), at 0.46%. The 305 delayed services attributable to LSPH (for example, due to trespass on the network, or points failures) in the latest year was an 87% increase on the 163 services delayed in the previous year. Additionally, the number of delayed trains for the latest year represents a 22% increase on the 249 services delayed five years ago before the pandemic. The quarterly breakdown of these delays is shown in Figure 2.2.
Figure 2.2 Delayed train services per 1,000 trains operated attributed to London St. Pancras Highspeed by quarter, 1 April 2017 to 31 March 2026
Source: London St. Pancras Highspeed Performance Floor Report
Performance against stretch target
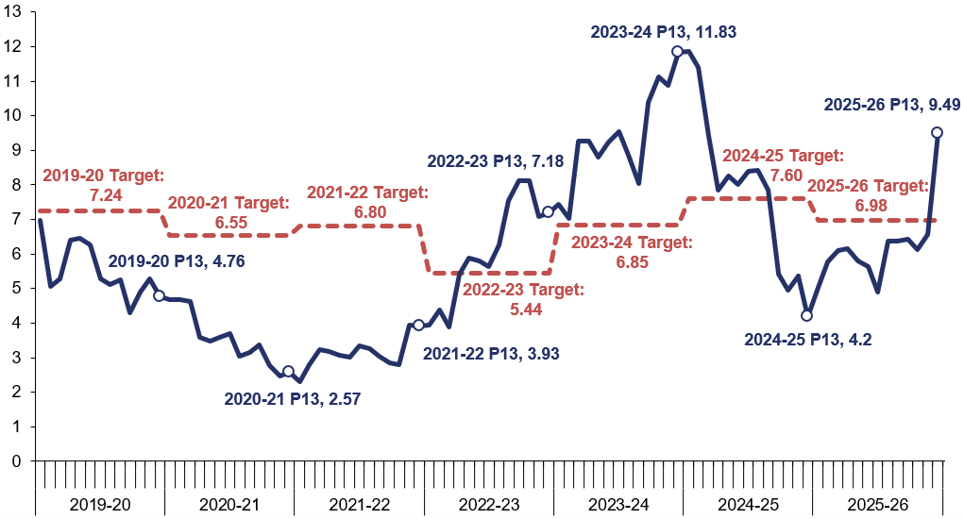
In terms of the stretch target for the latest year (6.98 seconds delay per train), the average delay per train due to LSPH-attributable incidents was worse than the target, at 9.49 seconds. There has been a deterioration in performance since the previous year, when the average delay per train was 4.2 seconds. Figure 2.3 shows the year-on-year average delay per train service attributed to LSPH.
Figure 2.3 Moving annual average delay per train service attributed to London St. Pancras Highspeed by period, 1 April 2019 – 31 March 2026
Source: London St. Pancras Highspeed Asset Management Annual Statement (AMAS), 1 April 2025 to 31 March 2026.
In summary, there has been a trend of increasing delays over this year, with a large increase in delay in rail period 13 leading to the moving annual average rising above the annual target. Causes of these delays (in particular points failures) are discussed in the next chapter of this report.
We have seen LSPH focus on returning to achieving the level of train service provision it set itself as a stretch target, and we will continue to challenge LSPH to ensure that it is minimising delays through best practice asset management, as discussed in the following chapter.