

Financial performance
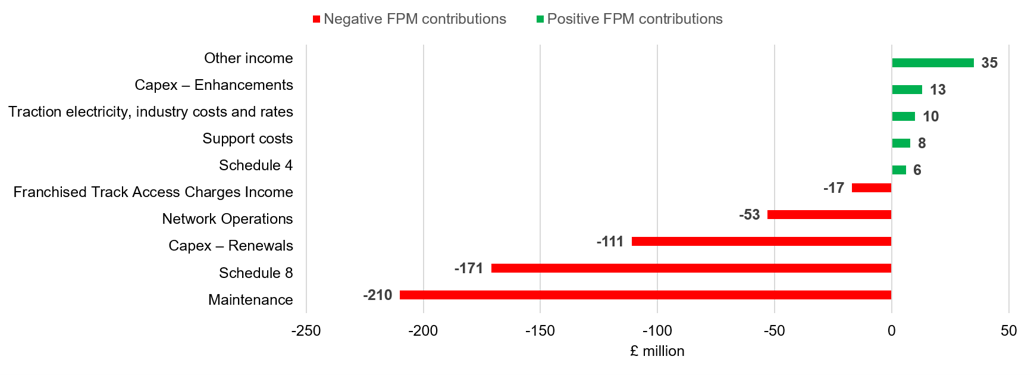
2.1 Due to higher than expected inflation and other pressures in the year, Network Rail reported a £490 million underperformance against its original CP7 delivery plan (DP24). This means that net of income, Network Rail spent £490 million more than originally planned. The factors that have contributed to Network Rail’s underperformance in the year are shown in Figure 2.1 with further details in Table 2.1.
Figure 2.1: Contributions to Network Rail’s financial underperformance in April 2025 to March 2026
Source: ORR analysis of Network Rail’s data
2.2 Network Rail’s financial underperformance in 2025-26 was driven primarily by higher maintenance costs, reflecting increased maintenance activity and staff pay increases above inflation. Schedule 8 performance also contributed to underperformance, as train delays and cancellations exceeded targets.
Table 2.1: Network Rail’s financial performance, Great Britain, April 2025 to March 2026
| £ million, cash prices | Actual | Original CP7 delivery plan for Year 2 | Variance | FPM out / (under) performance | % of FPM contribution |
|---|---|---|---|---|---|
| Network grant income | 8,127 | 8,175 | (48) | 0 | 0 |
| Franchised track access charges | 3,385 | 3,401 | (16) | (17) | 3% |
| Other single till income | 831 | 797 | 34 | 35 | (7%) |
| Total income | 12,343 | 12,373 | (30) | 18 | (4%) |
| Network operations | 963 | 910 | (53) | (53) | 11% |
| Support costs | 1,137 | 1,185 | 48 | 8 | (2%) |
| Traction electricity, industry costs and rates | 1,285 | 1,296 | 11 | 10 | (2%) |
| Maintenance | 2,657 | 2,439 | (218) | (210) | 43% |
| Schedule 4 | 307 | 322 | 15 | 6 | (1%) |
| Schedule 8 | 177 | 6 | (171) | (171) | 35% |
| Total operating expenditure | 6,526 | 6,158 | (368) | (410) | 84% |
| Capex – Renewals | 3,654 | 3,968 | 314 | (111) | 23% |
| Capex – Enhancements | 1,896 | 2,136 | 240 | 13 | (3%) |
| Total capital expenditure | 5,550 | 6,104 | 554 | (98) | 20% |
| Risk expenditure | 0 | 139 | 139 | 0 | 0 |
| Financing costs and other | 2,952 | 2,884 | (68) | 0 | 0 |
| Total expenditure | 15,028 | 15,285 | 257 | (508) | 104% |
| Financial performance measure (FPM) | (490) | 100% |
Source: ORR analysis of Network Rail’s data. Numbers may not sum due to rounding. Note that total income does not equal total expenditure, this is because of the timing of recognition of income and expenditure (particularly in relation to indexed-linked financing costs) as explained in Network Rail’s regulatory financial statements.
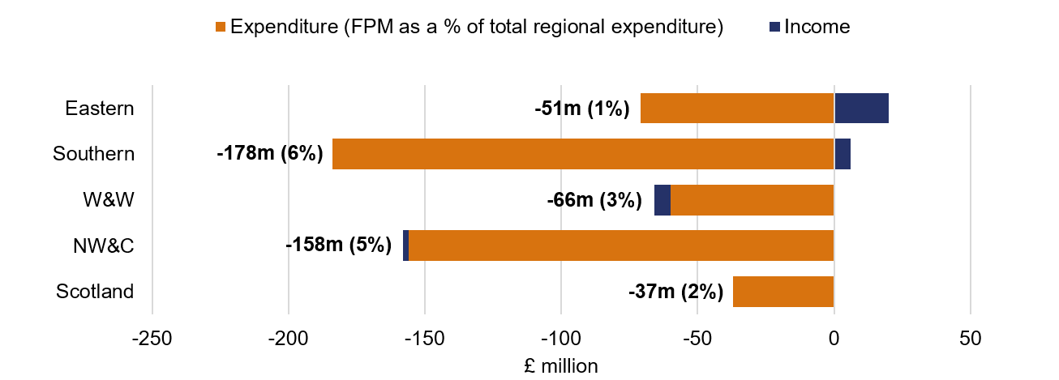
2.3 Figure 2.2 shows the contributions of Network Rail’s five regions to the company’s financial underperformance. Further detail on regional performance can be found in Chapter 5.
Figure 2.2: Regional contributions to Network Rail’s financial underperformance, April 2025 to March 2026
Source: ORR analysis of Network Rail’s data
Expenditure
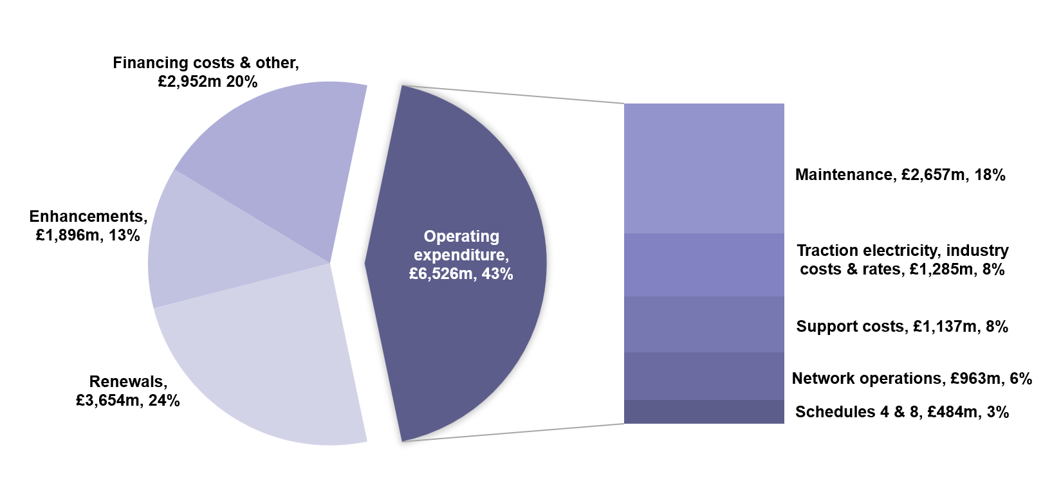
2.4 Network Rail spent £15.0 billion from April 2025 to March 2026, a 1% year-on-year increase. Figure 2.3 shows the main categories of Network Rail’s expenditure.
Figure 2.3: Network Rail’s expenditure from April 2025 to March 2026
Source: ORR analysis of Network Rail’s data
Operating expenditure
2.5 Operating expenditure relates to maintenance activities, network operations, support costs, traction electricity, industry costs and rates, and the Schedule 4 and 8 regimes.
2.6 Operating expenditure was £6.5 billion, with an underperformance of £410 million in the year. This was largely driven by underperformance of maintenance costs (£210 million) and Schedule 8 (£171 million).
Maintenance
2.7 Maintenance expenditure relates to activities that maintain the condition and capability of the existing infrastructure to the previously assessed standard of performance.
2.8 Maintenance expenditure was £2.7 billion, underperforming by £210 million. The main drivers were pay awards for staff that exceeded CPI inflation assumptions and wider inflationary pressures across the supply chain. Network Rail also incurred additional maintenance costs associated with increased reactive maintenance activity, including work undertaken in response to reduced renewals delivery, as well as the increased scope and complexity of maintenance work.
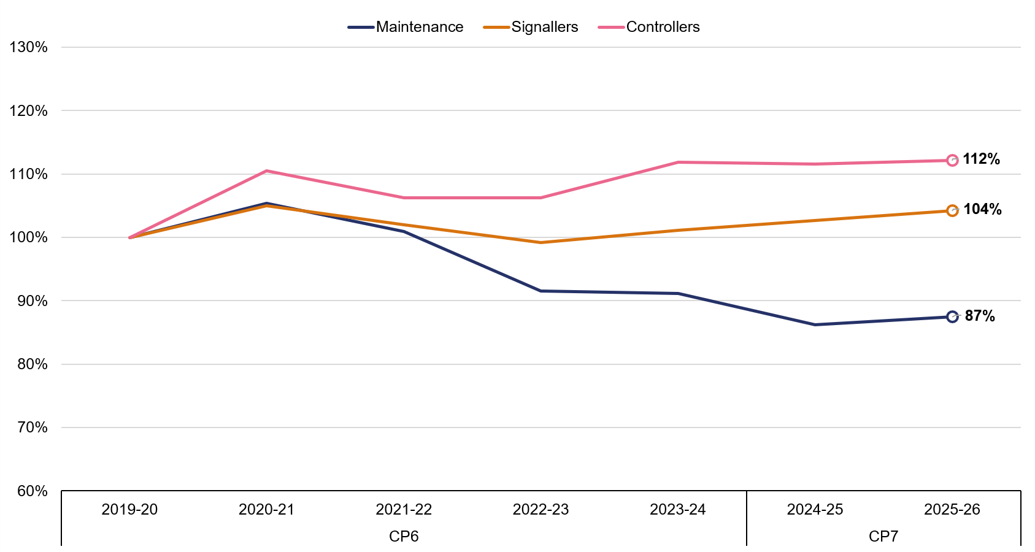
2.9 Network Rail has sought to deliver efficiencies through its maintenance modernisation programme, with maintenance headcount reducing by 9% since the start of the previous control period, CP6. However, the associated workforce changes created short-term vacancy gaps, increasing reliance on temporary resources, overtime and the recruitment and training of new staff, which contributed to higher than planned costs.
2.10 Network Rail plans to undertake additional maintenance activity in response to reduced renewals delivery and funding challenges to help manage asset condition and performance risks. While the company has provided some positive evidence of regional initiatives to rebalance renewals and how it intends to carry out additional maintenance activity to stabilise its plans, further evidence is required to demonstrate the long-term sustainability of this approach. Further details on our assessment of Network Rail's maintenance plans, resource capability and asset condition risks can be found in our Network Rail Annual Assessment 2026.
Network operations, support costs
2.11 Network operations expenditure relates to activities such as signalling and operating Network Rail’s managed stations. Network operations costs were £963 million, with an underperformance of £53 million. This is due to higher than expected pay awards to front line staff and additional expenditure on train performance initiatives.
2.12 Support costs relate to activities that facilitate Network Rail’s core business activities including corporate functions and IT services. Support costs were £1.1 billion and outperformed by £8 million in the year. This was largely due to a higher than anticipated proportion of projects being classified as capital expenditure and reduced utility costs.
Schedule 4 & 8
2.13 The Schedule 4 regime compensates train operators for planned reductions to network availability. It incentivises Network Rail to plan engineering work early and efficiently to reduce disruption. The Schedule 8 performance regime compensates train operators or Network Rail for the impact of unplanned service disruption.
2.14 Schedule 4 costs were £307 million in year, with an outperformance of £6 million. This was due to fewer major weather events impacting possessions, which caused fewer disruptions. This reduced costs compared to the delivery plan.
2.15 Schedule 8 costs were £177 million with an underperformance of £171 million. Punctuality and cancellation levels were the main drivers which were worse than planned, resulting in increased compensation payments to train operators. This was further compounded by several smaller incidents across the network which included cable theft and trespassing resulting in delays and cancellations. Further details about Network Rail's train performance can be found in our Network Rail Annual Assessment 2026.
Capital Expenditure
2.16 Capital expenditure relates to renewals and enhancements. Capital expenditure totalled £5.6 billion and underperformed by £98 million. This was largely driven by a £111 million underperformance of renewals which was slightly offset by £13 million outperformance of enhancements.
Renewals
2.17 Renewals expenditure relates to activities to replace (in whole, or in part) network assets that have deteriorated such that they can no longer be maintained economically. Renewal of an asset restores the original performance of the asset and can add additional functionality as technology improves.
2.18 Network Rail spent £3.7 billion renewing the rail network. This represented an underspend of £314 million compared to the delivery plan. For the renewals work that was delivered, Network Rail overspent (i.e. underperformed) by £111 million. The reasons for this are examined below.
2.19 The underperformance was primarily driven by higher-than-expected inflation, which increased the cost of delivering renewals and contributed to reductions in planned effective volumes (c.12%). Delivery issues were also experienced across several renewals programmes, most notably signalling, which accounted for 41% of the total renewals underperformance. As set out in our Network Rail Annual Assessment 2026, the lower renewals volumes, including the deferral of digital signalling renewals, is increasing reliance on maintenance and minor works, with potential implications for long-term asset sustainability, reliability and performance.
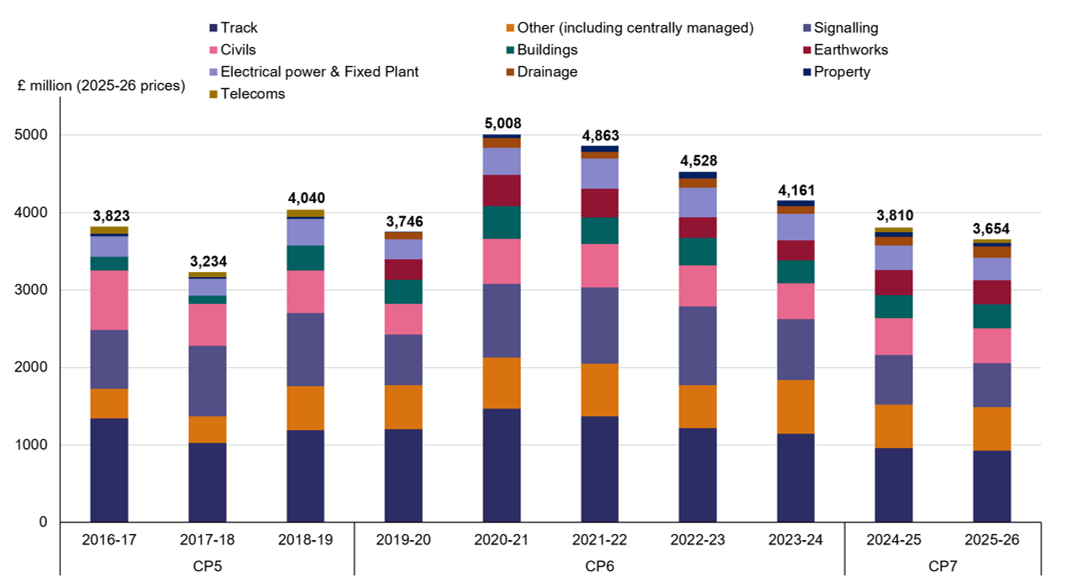
Figure 2.4: Network Rail renewals expenditure, Great Britain, April 2016 to March 2026
Source: ORR analysis of Network Rail’s data
2.20 As shown in Figure 2.4, following an increase in renewals expenditure in early CP6, renewals expenditure has declined year-on-year over the past five years and was 27% lower in 2025-26 than its peak in 2020-21. Rising delivery costs have reduced the volume of renewals that Network Rail can deliver within available funding, meaning less work is being delivered for a given level of expenditure. As highlighted in our Network Rail Annual Assessment 2026, lower renewals volumes increase the risk of asset condition declining over time, which could lead to more asset failures and poorer safety and performance outcomes in the long term. Lower levels of renewals activities beyond an asset’s economic life may also increase future funding requirements if renewals work is delayed and not effectively managed.
Enhancements
2.21 Enhancements are changes to improve network capacity or capability, for example, enabling more train journeys or higher speeds.
2.22 Network Rail spent £1.9 billion on enhancements in the year, with a £13 million outperformance. This is a reduction of £255 million compared to the previous year. The largest three enhancement schemes in 2025-26 were:
- Transpennine Route Upgrade (£1,022 million) – A major railway upgrade programme across the North of England, delivering increased capacity, electrification, faster journeys and improved reliability between Manchester, Leeds and York.
- East Coast Digital Programme (South) (£151 million) – A programme to introduce digital signalling on the southern section of the East Coast Main Line, improving railway performance, safety and network capacity.
- Midland Mainline Programme (£69 million) – A major enhancement programme to modernise the Midland Main Line through electrification, line speed improvements, bridge and tunnel modifications, and station upgrades, improving capacity, reliability and journey times across the route.
2.23 Further information on Network Rail’s enhancements can be found in the capital investments section in our Network Rail Annual Assessment 2026.
Employment costs
2.24 Network Rail's permanent staff costs (excluding agency staff) increased by 5% in real terms to £3.2 billion in the year, representing 21% of its annual expenditure. Permanent staff headcount increased by 2% to around 41,800 full-time equivalent employees (FTE).
2.25 The average employment costs of an FTE increased by 1% to over £67,000 per employee. Around 26% of employment costs relate to overtime, allowances, performance-related pay and employer pension contributions. Average employment costs have increased by around 2% above inflation over the past ten years, broadly in line with the 3% real-terms increase in average UK earnings reported by the Office for National Statistics.
2.26 Around 20% of the increase in staff costs relates to higher employer National Insurance Contributions (NIC), which are outside Network Rail's control and are treated as an external cost pressure.
Figure 2.5: Network Rail maintenance, signallers and controllers total employment costs, April 2019 to March 2026
Source: ORR analysis of Network Rail’s data
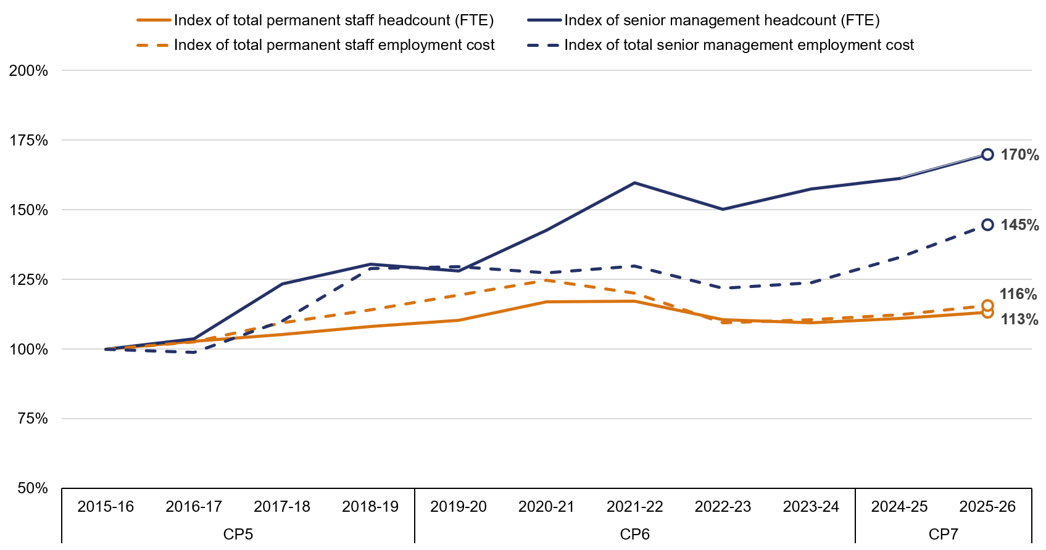
2.27 Network Rail employed 697 senior managers (Directors and Band 1) with an average employment cost, including employment benefits, of £179,000 (a 3% annual increase). The number of senior managers increased by 5% in the year, continuing a longer term trend of growing senior management positions. As shown in Figure 2.5, senior management headcount has increased by 70% over the past ten years, compared with 13% growth in the wider permanent workforce.
2.28 Over the same period, total employment costs for senior managers increased by 45%, compared with 16% for the wider permanent workforce, contributing to higher overall employment costs.
Figure 2.6: Network Rail maintenance, signallers and controllers total employment costs, April 2019 to March 2026
Source: ORR analysis of Network Rail’s data
2.29 Employment costs have varied across Network Rail's key operational workforce groups. As shown in Figure 2.6, since 2019-20, employment costs for maintenance staff have fallen by 13% in real terms, reflecting a reduction in maintenance headcount following Network Rail’s modernising maintenance programme. In contrast, employment costs for signallers have remained broadly stable, while controller employment costs have increased by 12%, driven by growth in both headcount and employment costs.
Efficiency
2.30 Our 2023 Periodic Review required Network Rail to achieve £3.9 billion of efficiency improvements in CP7. This target was embedded within Network Rail’s CP7 delivery plan and underpins its funding settlement.
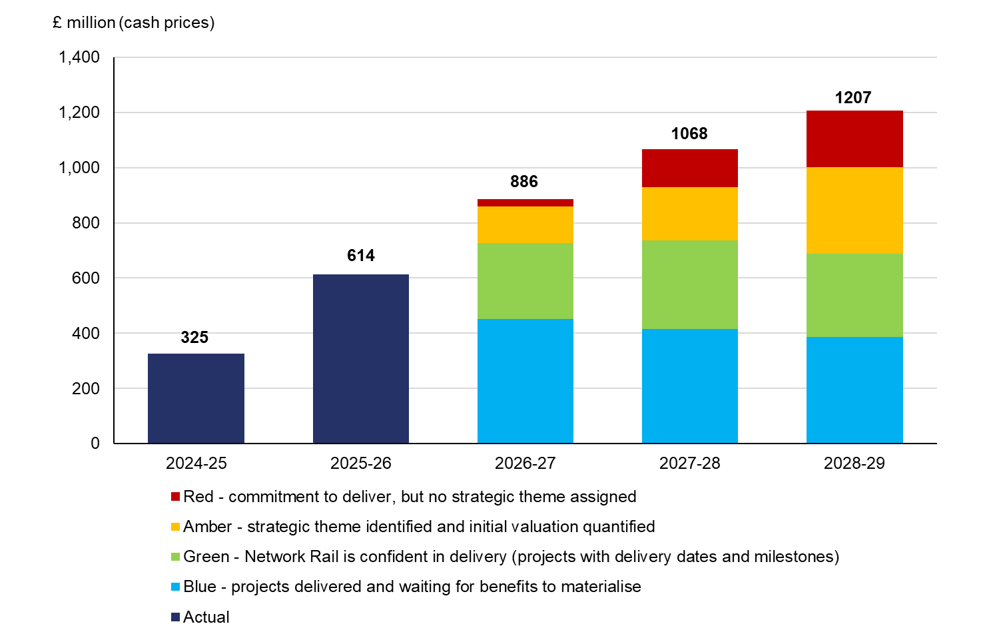
2.31 Network Rail delivered £614 million of efficiencies in the year, 4% ahead of its annual target with all five regions exceeding their own targets.
2.32 Key initiatives to support delivery included, negotiating contracts with improved terms or rates, enhancing market research and monitoring contracts more effectively, better management of staff related costs, improved planning, rescoping and delivery of projects and improving workbank planning through better coordination and sequencing of activities. Further detail on regional efficiency delivery is set out in Chapter 5.
2.33 Due to pressures on its budget from inflation and from drawing less on government funding than envisaged in PR23 (see above), Network Rail has now increased its own efficiency target and is aiming to deliver £4.1 billion of efficiency improvements in CP7. This will help to support its planned renewals programme.
Figure 2.7: Network Rail’s actual and latest CP7 forecast efficiency improvements
Source: ORR analysis of Network Rail’s data
2.34 Whilst Network Rail has exceeded its efficiency targets in the first two years of CP7, more than 75% of Network Rail's CP7 efficiency target remains to be delivered.
2.35 Delivering the remaining efficiencies will be important to improving the affordability and long-term sustainability of the railway. Our role in monitoring how Network Rail delivers its CP7 efficiency target in a way that is sustainable, measurable and aligned with financial performance and long-term asset condition supports our growth goals and builds on our longstanding role in assessing Network Rail's efficiency performance and promoting value for money.
2.36 The efficiencies delivered to date, and those planned over the remainder of CP7, can help release resources for investment, strengthen the railway's financial sustainability and support future growth for passengers, freight users and the wider economy. They can also help support a more stable and predictable workbank, providing greater confidence for the supply chain through increased certainty over future activity and creating conditions that support innovation and productivity improvements across the sector.
2.37 We will continue to monitor progress against the CP7 efficiency target and report on delivery, helping to ensure that efficiencies are realised in a way that supports a more affordable, sustainable and growth-focused railway. While responsibility for delivering these efficiencies will transition from Network Rail to Great British Railways (GBR) as rail reform progresses, the importance of delivering CP7 efficiency commitments, and ORR's monitoring of progress against them, will remain unchanged.
Inflation, input prices, headwinds, tailwinds and scope changes
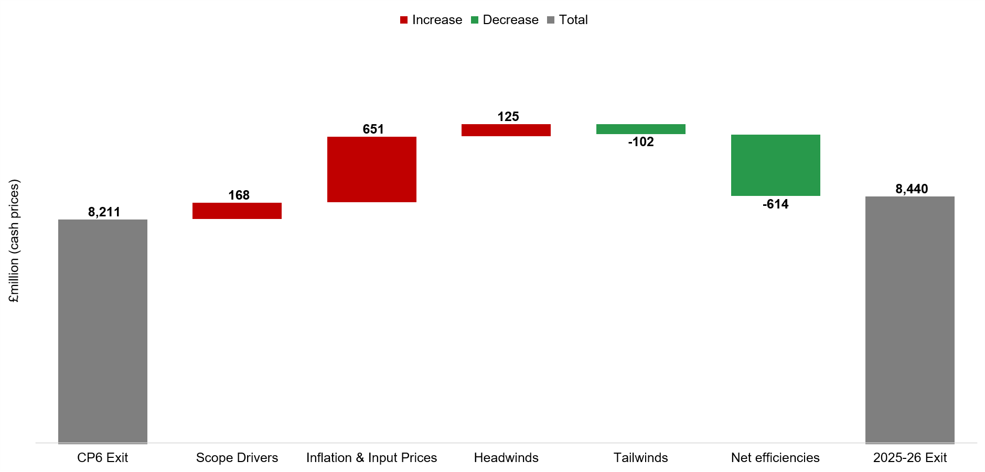
2.38 Efficiency improvements remained the primary offset to cost pressures during the year. However, efficiencies delivered in Year 2 were lower than the combined impact of inflation and input price increases. When combined with other cost pressures, this contributed to expenditure increasing by more than £200 million compared with the CP6 exit position.
2.39 Figure 2.8 shows the main drivers of changes to Network Rail’s operations, maintenance, support and renewals expenditure in 2025-26. It breaks cost movements down into scope drivers (changes to complexity or volumes of work), inflation, external factors (headwinds and tailwinds), and efficiencies net of inefficiencies.
Figure 2.8: Network Rail’s Year 2 cost drivers, compared to CP6 exit
Source: ORR analysis of Network Rail’s data
2.40 Network Rail reported £168 million in additional costs due to scope changes during the year, primarily reflecting additional work required to maintain network performance, safety and asset condition beyond that assumed in the delivery plan.
2.41 Inflation and input prices totalled £651 million for the year, mainly driven by CPI inflation (£492 million) and higher input price (£159 million), including increases in the cost of materials, contracts and other externally sourced goods and services.
2.42 Network Rail has reported £125 million in headwinds, mostly due to the increase in employer national insurance contributions that took effect in 2025. Network Rail benefited from £102 million in tailwinds during the year, mainly due to lower support costs as a result of reduced work supporting the development of HS2’s future connection to the national rail infrastructure.
Leading indicators of efficient delivery
2.43 In this section we update on Network Rail’s preparations to deliver efficiently in 2026-27, the third year of CP7.
2.44 Network Rail considers that 83% of its regional 2026-27 target efficiency will be achieved from projects that have already been delivered or have clear project plans (blue and green categories in the table below), putting it in a good position for Year 3 delivery. The remainder (17%) have plans in place but low confidence in delivery or no plans in place (yellow and red categories in the table below).
Table 2.2: Network Rail’s assessment of the maturity of its April 2026 to March 2027 efficiency plans as of 31 March 2026
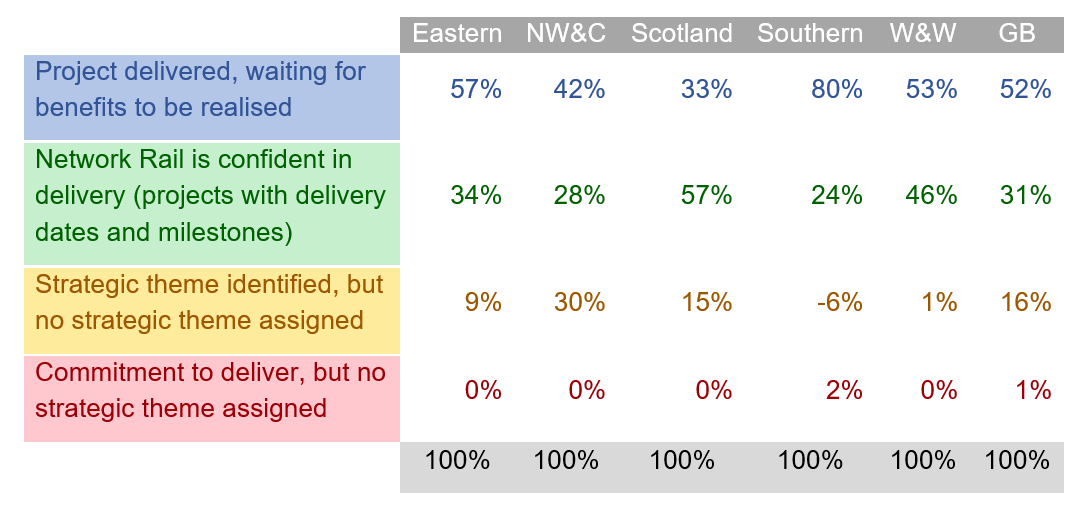
Table 2.2: Accessible version
| Eastern | NW&C | Scotland | Southern | W&W | GB | |
|---|---|---|---|---|---|---|
Project delivered, waiting for benefits to be realised | 57% | 42% | 33% | 80% | 53% | 52% |
Network Rail is confident in delivery (projects with delivery dates and milestones) | 34% | 28% | 57% | 24% | 46% | 31% |
Strategic theme identified, but no strategic theme assigned | 9% | 30% | 15% | -6% | 1% | 16% |
Commitment to deliver, but no strategic theme assigned | 0% | 0% | 0% | 2% | 0% | 1% |
100% | 100% | 100% | 100% | 100% | 100% |
Source: ORR analysis of Network Rail’s data. Note, Network Rail GB data includes national functions plan maturity.
2.45 Network Rail's Year 3 renewals planning indicators suggest it is better prepared for delivery than at the same point last year. These indicators measure readiness to deliver renewals work, including whether projects have received the necessary approvals, whether delivery organisations have accepted the work allocated to them, and whether sufficient access to the railway has been secured to undertake planned engineering activities.
2.46 Across the network, 66% of renewal projects had been authorised, 70% of remits had been accepted and access equivalent to 109% of the planned requirement had been secured. Access secured exceeded planned requirements, reflecting additional access booked to manage potential slippage and support delivery. Chapter 5 provides a more detailed regional analysis of these leading indicators.
Income
2.47 Network Rail received £12.3 billion of income in the year, a 2% annual increase. It also received separate government funding for £1.9 billion of enhancements to the network.
2.48 Figure 2.9 provides a breakdown of the main sources for this income. Overall income is higher than the previous year largely due to higher grant income, which is consistent with the delivery plan target.
Figure 2.9: Breakdown of Network Rail’s income for April 2025 to March 2026 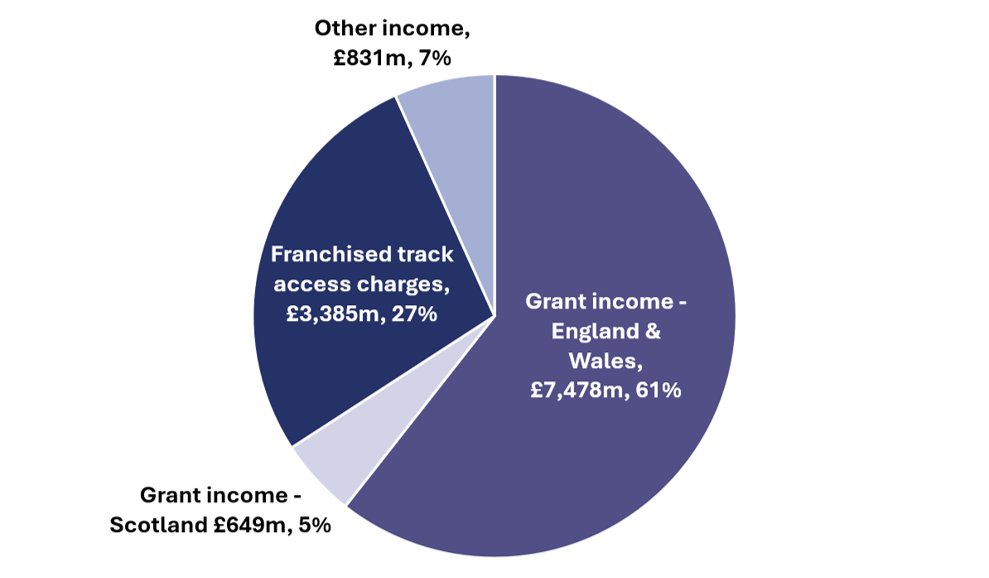
Source: ORR analysis of Network Rail’s data
Grant income
2.49 Network Rail received £8.1 billion of grant income in 2025-26. This comprised £7.5 billion from DfT for England & Wales and £439 million from Transport Scotland for Network Rail Scotland. A further £210 million was provided by DfT to Network Rail Scotland to fund its share of financing costs, British Transport Police costs and corporation tax. Grant income was £48 million below the delivery plan, mainly reflecting lower expenditure than planned.
Figure 2.10: Network Rail grant income, England & Wales and Scotland, April 2016 to March 2026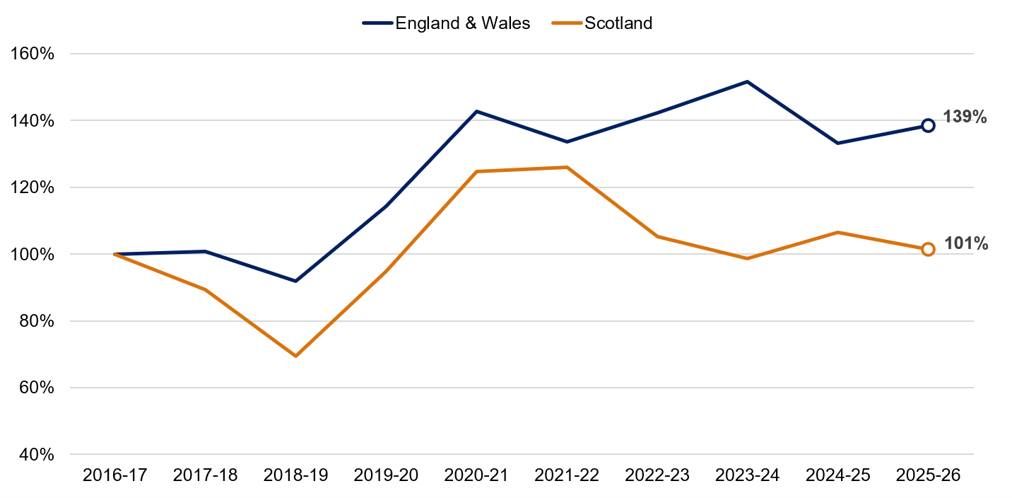
Source: ORR analysis of Network Rail’s data
2.50 As shown in Figure 2.10, grant income has increased over the last decade, although the trend differs between England & Wales and Scotland. The growth reflects changes in funding settlements across control periods, including differences in the level of planned expenditure and the level of funding provided, as well as higher internal financing grants. Internal financing grants have increased in recent years, as higher interest rates have increased financing costs on debt instruments (excluding financing costs associated with index-linked debt), with these costs funded by DfT for both England & Wales and Scotland.
2.51 As grant income is used to fund Network Rail’s expenditure, changes in grant income generally reflect changes in spending rather than financial performance. Any differences between actual and planned grant income are therefore treated as financially neutral.
Franchised track access charges income
2.52 Franchised track access charge income was £3,385 million, with a £17 million financial underperformance. This was due to fewer train services than forecast reducing variable usage charge income. This was partly offset by higher infrastructure cost charge income. Franchised track access charge income in the prior year (i.e. 2024-25) was £3,465 million, representing a year-on-year decrease of £80 million (2%), largely due to reduced traction electricity income.
Other income
2.53 Network Rail received £831 million of income from other sources in 2025-26. These included access charges paid by freight operators (£89 million), together with income from commercial properties (£337 million), stations and depots (£405 million). This delivered £35 million of financial outperformance, driven primarily by higher property rental income and retail income.