

5.1 This chapter compares and examines the performance of Network Rail’s five regions and the National Functions: Eastern, North West & Central (NW&C), Scotland, Southern, and Wales & Western (W&W).
Regional financial performance
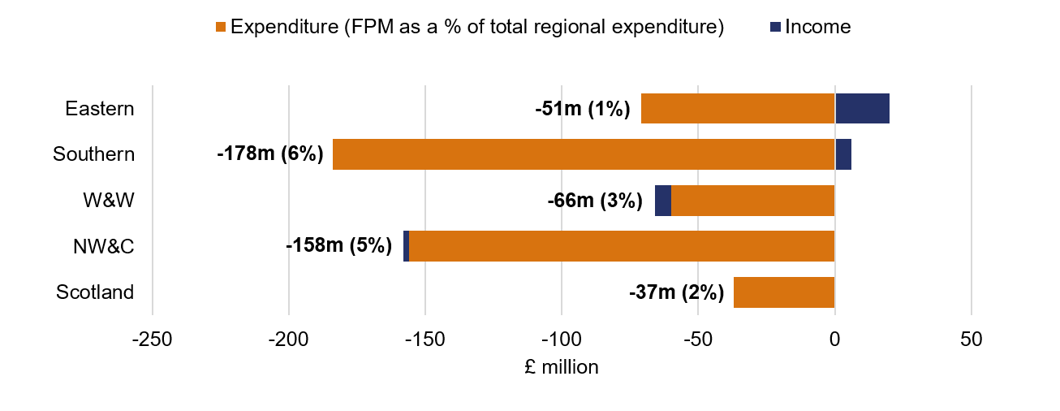
Figure 5.1: Regional contributions to Network Rail’s financial underperformance, April 2025 to March 2026
Source: ORR analysis of Network Rail’s data
5.2 Financial performance varied across Network Rail's regions in 2025-26. Scotland delivered the strongest financial performance, contributing the least to Network Rail's overall underperformance, while Southern and North West & Central together accounted for around two-thirds of the company's total underperformance.
5.3 Maintenance cost pressures were evident across much of the regions. Southern, North West & Central and Wales & Western all reported significant maintenance underperformance, driven by higher costs as a result of higher-than-planned inflation, increased supply chain costs and pay awards above CPI inflation. Several regions also undertook additional maintenance activity to manage asset condition and operational risks, including where renewals volumes were reduced to remain within funding.
5.4 The main drivers of underperformance differed between regions. Southern's underperformance was largely in renewals and maintenance, reflecting increased cost of delivering its plan. North West & Central and Eastern experienced significant Schedule 8 underperformance arising from operational incidents and asset failures, with North West & Central recording the highest Schedule 8 costs across the regions.
5.5 Wales & Western reported a lower level of underperformance than Southern and North West & Central. The region was impacted by higher maintenance cost pressure and also incurred additional costs associated with seasonal management and readiness activities.
5.6 Some regions benefited from offsetting factors. Eastern delivered the strongest Schedule 4 performance across the regions, reflecting more productive engineering possessions and lower planned disruption, and was one of two regions to report renewals outperformance. Scotland delivered the strongest overall financial performance and, alongside Eastern, also outperformed on renewals, demonstrating effective management of financial pressures during the year.
Regional efficiency delivery
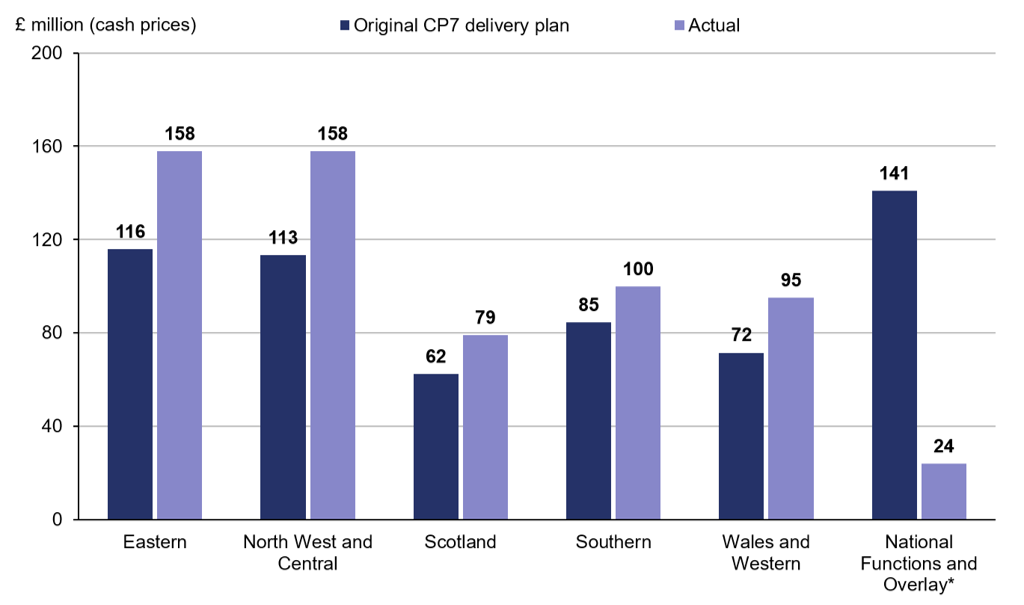
Figure 5.2: Regional contributions to efficiency improvements in April 2025 to March 2026
* An overlay represents reductions to reported efficiencies where the underlying figures have not been fully validated or assurance processes are still ongoing.
Source: ORR analysis of Network Rail’s data
5.7 All regions exceeded their original Year 2 efficiency delivery plans, collectively delivering £614 million of efficiencies. Eastern and North West & Central delivered the largest savings, while North West & Central achieved the largest outperformance against plan.
5.8 North West & Central and Eastern exceeded their original delivery plans by 39% and 36% respectively, while Wales & Western and Scotland exceeded plan by 32% and 27%. Southern also exceeded its original plan but reported the lowest level of outperformance at 18%.
Table 5.1: Top 5 key efficiency initiatives, annual data, April 2025 to March 2026
| Top 5 efficiency initiatives (£ million) | Eastern | North West & Central | Scotland | Southern | Wales & Western | National Functions | Total | % of Year 2 delivery |
|---|---|---|---|---|---|---|---|---|
| Contracting strategies/packaging/rates | 38 | 29 | 20 | 24 | 30 | 20 | 161 | 26% |
| Resource Management | 63 | 20 | 4 | 11 | 2 | 16 | 115 | 19% |
| Minimum Viable Product (MVP) | 24 | 32 | 8 | 4 | 2 | 5 | 75 | 12% |
| Workbank Planning / Synergies | 59 | 2 | 4 | 4 | 6 | 0 | 75 | 12% |
| Innovation and Technology | 2 | 5 | 3 | 8 | 20 | 26 | 63 | 10% |
Source: ORR analysis of Network Rail’s data
5.9 Table 5.1 highlights the largest efficiency initiatives delivered across Network Rail in Year 2. Contracting strategies, packaging and rates was the largest contributor, delivering £161 million of efficiencies and accounted for over a quarter of Year 2 delivery. Resource management was the second-largest contributor, delivering £115 million, while Minimum Viable Product (MVP) and Workbank Planning/Synergies each contributed £75 million.
5.10 Regions derived their efficiency savings from different initiatives. Eastern delivered the largest contribution from resource management and workbank planning activities, while North West & Central achieved significant savings through MVP and contracting initiatives. Wales & Western and National Functions delivered the largest innovation and technology savings, whilst contracting initiatives were the largest contributor in Scotland and Southern.
5.11 National Functions (including the System Operator and GBRx) delivered £125 million of efficiencies in Year 2, exceeding its revised delivery plan. This excludes a £101 million adjustment for regionally reported efficiencies that have not yet been assured, which is reported separately within Group Finance and reflected in the Network Rail-wide efficiency position shown in Figure 5.2. Innovation and technology, contracting initiatives and resource management represented the largest sources of savings at a national level.
5.12 Further detail on Network Rail’s ten largest efficiency initiatives in Year 2 of CP7 can be found in Annex C.
Leading Indicators
5.13 Table 5.2 shows that most regions have developed plans for the majority of their remaining CP7 efficiencies, although confidence in delivery varies. Wales & Western has the highest proportion of efficiencies either delivered, enabled or supported by defined delivery plans (90%), followed by Scotland (82%). In contrast, North West & Central and Eastern have a larger proportion of efficiencies linked to strategic themes that have yet to be developed into specific projects, reducing confidence in delivery over the remainder of CP7.
5.14 Southern has a comparatively high proportion of efficiencies that have not yet been linked to a strategic theme or project. While the region has delivered efficiencies successfully to date, further development of its plans will be needed to provide confidence that the remaining CP7 target can be achieved.
Table 5.2: Network Rail’s assessment of the maturity of its CP7 efficiency plans as of 31 March 2026
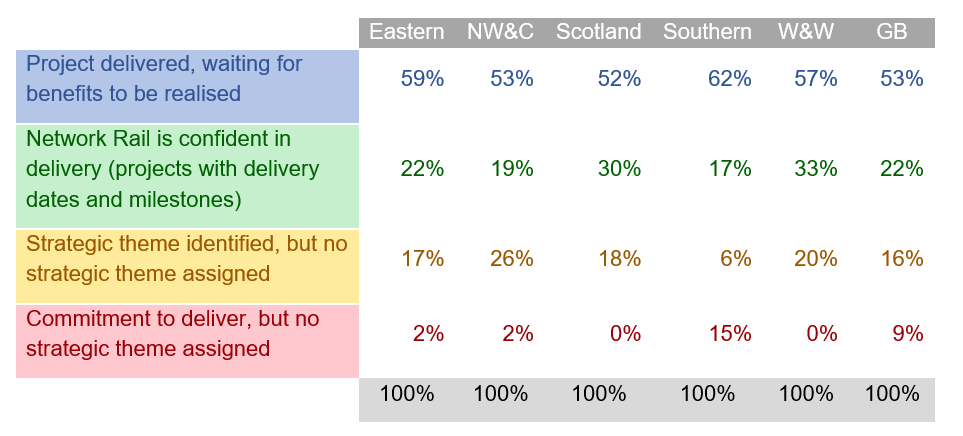
Table 5.2: Accessible version
Eastern | NW&C | Scotland | Southern | W&W | GB | |
|---|---|---|---|---|---|---|
| Project delivered, waiting for benefits to be realised | 59% | 53% | 52% | 62% | 57% | 53% |
| Network Rail is confident in delivery (projects with delivery dates and milestones) | 22% | 19% | 30% | 17% | 33% | 22% |
| Strategic theme identified, but no strategic theme assigned | 17% | 26% | 18% | 6% | 20% | 16% |
| Commitment to deliver, but no strategic theme assigned | 2% | 2% | 0% | 15% | 0% | 9% |
100% | 100% | 100% | 100% | 100% | 100% |
Source: ORR analysis of Network Rail’s data. Note, Network Rail GB data includes national functions plan maturity.
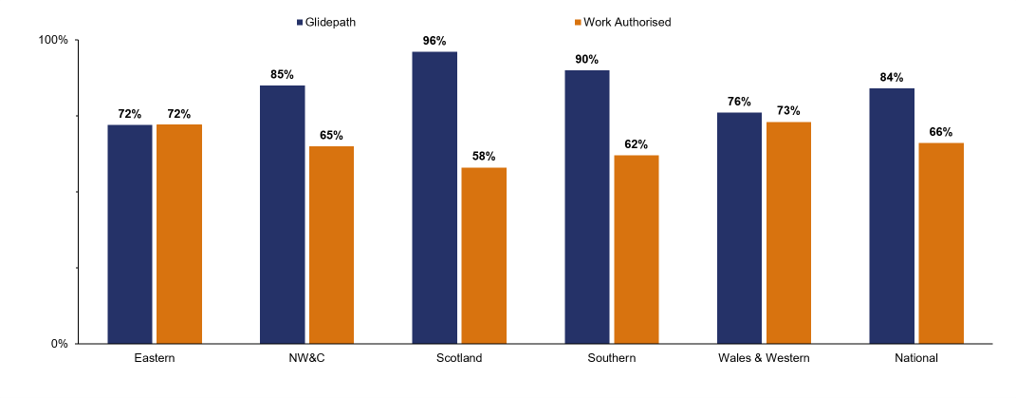
Figure 5.3: National and regional financial authorisations, April 2026 to March 2027
Source: ORR analysis of Network Rail’s data
5.15 Financial authorisations provide an indication of how well regions are preparing their renewals programmes for delivery in Year 3. Across Network Rail, 66% of planned renewals expenditure had been authorised by March 2026, below the national glidepath target of 84%. Eastern was the only region to remain on track against its glidepath target, while Wales & Western performed better than all other regions and remained above the national average, despite remaining below its target.
Figure 5.4: National and regional renewals remits, April 2026 to March 2027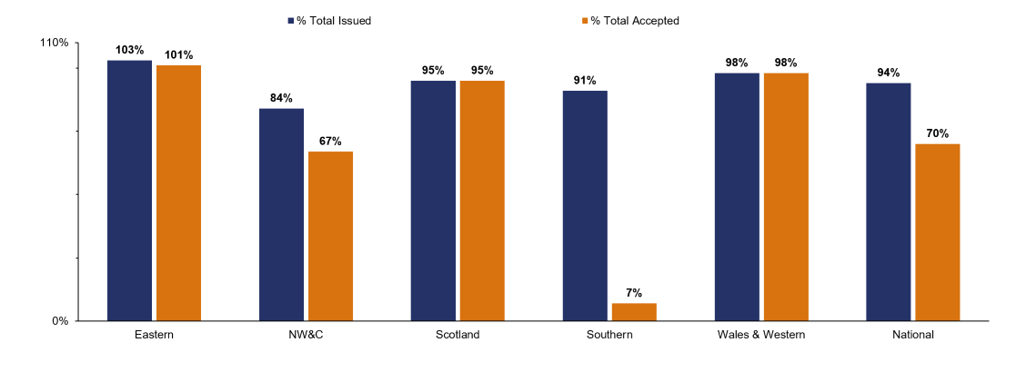
Source: ORR analysis of Network Rail’s data
5.16 Financial authorisations provide only a partial view of renewals readiness. Remits issued to and accepted by the supply chain provide an additional indication of workbank development. Nationally, 94% of remits had been issued and 70% accepted by March 2026. Eastern, Scotland and Wales & Western were ahead of the national average on both measures, suggesting strong progress in developing their Year 3 workbanks.
5.17 Southern remains a notable exception, with a very low remit acceptance rate. Delays in the formal acceptance of work continues to create uncertainty around delivery readiness.
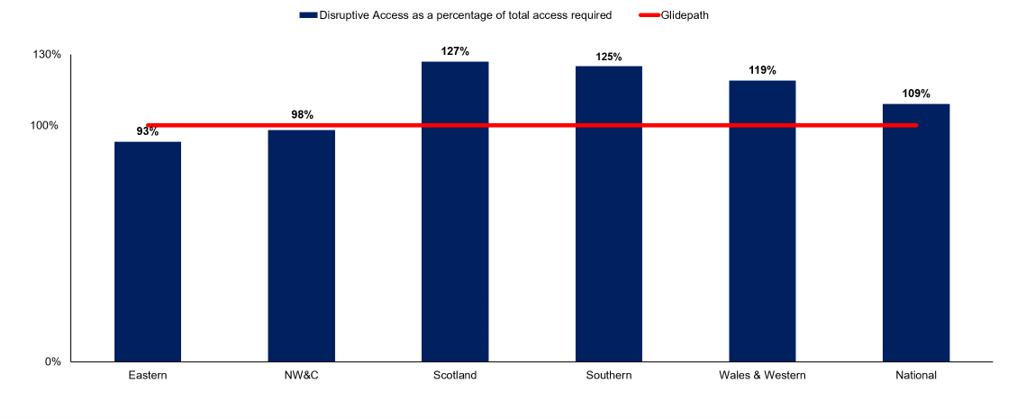
Figure 5.5: National and regional disruptive access, April 2026 to March 2027
Source: ORR analysis of Network Rail’s data
5.18 Securing disruptive access is another important leading indicator of delivery confidence. Network Rail had secured 109% of the disruptive access required for Year 3 by March 2026, exceeding planned requirements and providing a buffer to manage potential slippage and support delivery of planned work. Scotland, Southern and Wales & Western were all above the national average, reducing the risk that access constraints will affect delivery of their planned work.
Regional and National Functions performance summaries
Eastern
5.19 Eastern faced a number of financial and operational challenges in Year 2. Despite these pressures, the region made good progress in delivering efficiencies and in areas that should support performance over the remainder of CP7.
Financial performance
5.20 Eastern underperformed by £51 million compared to its original delivery plan. The underperformance was largely attributable to:
- Schedule 8 (£43 million underperformance), largely due to circuit and cable-related failures and fires across the region. These incidents contributed to delays and cancellations, resulting in performance below benchmark levels and higher compensation payments to train operators.
- Maintenance Costs (£37 million underperformance), driven by higher than planned inflation which increased delivery costs, staff pay awards above CPI and additional maintenance activity, including vegetation management, crossing defect and rail detection replacements.
5.21 Eastern’s underperformance was partially offset by outperformance largely relating to:
- Schedule 4 (£24 million outperformance), driven by more productive engineering possessions resulting in lower levels of planned disruption across the region.
- Renewals (£1 million outperformance), reflecting improved workbank planning, with resource sharing and extended access windows helping to support additional switches and crossing volumes.
Efficiency
5.22 Eastern delivered £158 million of efficiencies in Year 2, exceeding its original delivery plan (£116 million) by 36%. Delivery was supported in part by national programmes, which contributed around 14% of total savings. During the year, Eastern identified an additional £69 million to help mitigate the continued financial pressures across Network Rail. Eastern has delivered 28% (£277 million) of its £990 million CP7 efficiency target across the first two years.
5.23 The largest three efficiency initiatives for the region in the year were Resource Management (£63 million), Workbank Planning / synergies (£59 million) and Contracting strategies/ packing / rates (£38 million).
North West & Central
5.24 North West & Central exceeded its efficiency target in Year 2, demonstrating strong delivery of efficiency initiatives. However, the region reported significant financial challenges particularly in operating expenditure, largely driven by Schedule 8 costs.
Financial performance
5.25 North West & Central underperformed by £158 million compared to its original delivery plan. The underperformance was largely attributable to:
- Schedule 8 (£92 million underperformance), largely due to overhead line equipment failures, an axle counter failure and a train derailment caused by inadequate drainage. These events resulted in significant delays and cancellations, leading to higher compensation payments to train operators.
- Maintenance costs (£49 million underperformance), driven by increased cost as a result of higher-than-planned inflation, additional maintenance activity to compensate for reduced renewals delivery and staffing cost pressures.
- Schedule 4 (£21 million underperformance), due to additional cost as a result of accelerated delivery activity that had been scheduled for later in CP7 and emergency access possessions. This resulted in greater than planned level of disruption to the network leading to additional compensation payments to train operators.
- Renewals (£13 million underperformance), due to sunk cost related to reprioritisation of works, project complexity and emergency works.
Efficiency
5.26 North West & Central delivered £158 million of efficiencies in Year 2, exceeding its revised delivery plan (£147 million) by 7% and its original delivery plan (£113 million) by 39%. Delivery was supported in part by national programmes, which contributed around 25% of total savings. Reflecting continued financial pressure across Network Rail, North West & Central has identified additional efficiency savings of £55 million. The region has delivered 30% (£252 million) of its £829 million CP7 efficiency target across the first two years.
5.27 The largest three efficiency initiatives for the region in the year were MVP (Minimum Viable Product) (£32 million), Contracting strategies/packaging/rates (£29 million), Resource Management (£20 million).
5.28 North West & Central has made good progress in developing its future efficiency pipeline. However, a significant proportion (26%) of remaining efficiencies are still to be developed into specific initiatives. Further development of its plans is needed to strengthen confidence in delivery over the remaining years of CP7.
Scotland
5.29 Detailed information on Network Rail Scotland’s financial and efficiency performance can be found in Chapter 4.
Southern
5.30 Southern made good progress in delivering efficiencies in Year 2, despite poor financial performance in renewals, maintenance and train operations.
Financial performance
5.31 In Year 2 of CP7, Southern underperformed financially against its original delivery plan by £178 million, reflecting higher costs to deliver planned outputs. The underperformance was largely attributable to:
- Renewals costs (£94 million underperformance), driven by inflationary pressures, increased work complexity, access constraints and worse-than-expected asset condition. As a result of these cost pressures, Southern faced a £217 million gap between its planned delivery over CP7 and available funding. To remain within its funding envelope, the region reduced planned renewals activities by around £350 million, with the additional reduction providing a buffer against future financial and delivery risks.
- Maintenance costs (£56 million underperformance), largely due to inflation which led to increased supply chain costs, maintenance reorganisation resulting in additional use of overtime, and additional track maintenance to manage asset condition and network performance.
- Schedule 8 costs (£34 million underperformance), due to increased delays and cancellations, resulting in higher compensation payments to train operators.
Efficiency
5.32 Southern delivered £100 million of efficiencies in Year 2, exceeding its revised delivery plan of (£98 million) by 2% and its original delivery plan of (£85 million) by 18%. This demonstrates positive progress in the year, with delivery supported by national programmes, which contributed around 22% of total savings. Reflecting continued financial pressure across Network Rail, the region has identified a further £50 million of efficiency savings, increasing its CP7 efficiency target to £705 million. The region has delivered 20% (£144 million) of its CP7 target across the first two years.
5.33 The largest three efficiency initiatives for the region in the year were Contracting strategies/packaging/rates (£24 million), Modernisation (£13 million) and Resource Management (£11 million).
Wales & Western
5.34 Wales & Western exceeded its efficiency targets in Year 2 despite continued financial pressures. While the region reported financial underperformance, it delivered strong efficiency performance and made good progress towards its CP7 efficiency target.
Financial performance
5.35 Wales & Western underperformed financially against its original plan by £66 million. The underperformance was largely attributable to:
- Maintenance costs (£50 million underperformance), driven by increased activity cost due to higher than planned inflation across the supply chain, pay awards above CPI and additional maintenance activity to ensure asset safety which led to staffing pressures and overtime.
- Network operation costs (£10 million underperformance), reflecting additional expenditure on seasonal management and readiness teams to improve performance.
- Renewals costs (£7 million underperformance), due to higher cost pressures which increased materials and labour costs. The region also incurred sunk costs due to the reduction in renewals volumes and complexity of specific schemes.
5.36 Wales and Western’s underperformance was partially offset by outperformance largely relating to:
- Schedule 4 (£7 million outperformance), reflecting improved workbank planning and more productive use of engineering possessions.
Efficiency
5.37 Wales & Western, delivered £95 million of efficiencies in Year 2, exceeding its revised delivery plan (£77 million) by 23% and its original delivery plan (£72 million) by 32%. Delivery was supported in part by national programmes, which contributed around 26% of total savings. Reflecting continued financial pressure across Network Rail, Wales & Western has identified additional efficiency savings of £37 million, increasing its CP7 efficiency target to £531 million. The region has delivered 32% (£172 million) of its efficiency target across the first two years.
5.38 The largest three efficiency initiatives for the region in the year were Contracting strategies/packaging/rates (£30 million), Innovation and Technology (£20 million) and Structural & Commercial – Improved access (£7 million).
National Functions
5.39 Network Rail’s National Functions support delivery across regions by underpinning network-wide operations and providing a range of centralised services. They comprise Route Services, Corporate Services, System Operator, Technical Authority and GBRx. In Year 2, National Functions delivered £125 million of efficiencies. This excludes a £101 million adjustment for regionally reported efficiencies that have not yet been assured, which is reported separately within Group Finance and included in the overall Network Rail efficiency position shown in Figure 5.2.
Route Services
5.40 Route Services delivered £95 million of efficiencies in Year 2, exceeding its original delivery plan of £91 million by 4% and its revised delivery plan of £89 million by 7%. Route Services remains on track to deliver its CP7 efficiency target of £442 million including £59 million from Project Reach, a programme to renew and upgrade telecommunications infrastructure across the rail network. The largest three efficiency initiatives were contracting strategies/packaging/rates (£40 million), innovations and technology (£25 million) and resource management (£11 million).
Corporate Services
5.41 Corporate Services delivered £2 million of efficiencies during the year, 50% below its original and revised delivery plan of £4 million. Despite the shortfall in Year 2, Corporate Services remains on track to deliver its CP7 efficiency target of £30 million, supported by the management efficiency programme, ongoing restructuring activity, and further scrutiny of third-party spend to identify additional opportunities.
System Operator
5.42 System Operator delivered £10 million of efficiencies during the year, exceeding its original delivery plan of £6 million by 80% and its revised delivery plan of £5 million by 101%. The system operator remains on track to meet its CP7 efficiency target of £36 million. The largest three efficiency initiatives were contracting strategies/packaging/rates (£2 million), pay and benefits (£2 million) and change in delivery model (£2 million).
Technical Authority
5.43 Technical Authority delivered £11 million of efficiencies during the year, exceeding its original and revised delivery plan of £7 million by 57%. Delivery was supported by external partnership investment programmes, contracting strategies/packaging/ rates (£9 million), including the renegotiation of signalling support contracts and industry memberships. Technical Authority remains on track to deliver its CP7 efficiency target of £53 million.
GBRx
5.44 GBRx, Network Rail’s transformation programme, achieved £7 million of efficiencies during the year, 17% above its original and revised delivery plan of £6 million and remains well placed to deliver CP7 target of £53 million in efficiencies. Efficiencies identified were across, contracting strategies/packaging/ rates (£6 million) and resource management (£1 million).