This is the accessible version of the Annual assessment of National Highways from April 2021 to March 2022.
Executive summary
Introduction
- National Highways was set up as a government-owned company in 2015, tasked with managing the strategic road network (SRN) – the motorways and major A-roads in England. In its second road investment strategy (RIS2) the government specified a set of outcomes and investments that it requires National Highways to deliver over the second road period (RP2), from April 2020 to March 2025.
- The Office of Rail and Road (ORR) holds National Highways to account for the delivery of the requirements set out in RIS2, its broader licence commitments and how it achieves its efficiency targets. This report sets out our assessment of National Highways’ performance in 2021-22.
- In 2021-22, travel restrictions put in place for the coronavirus (COVID-19) pandemic eased. Traffic levels across the SRN returned to close to normal levels. While rail services continued to be impacted, National Highways was able to work through the pandemic and return to business-as-usual. However, it faced its own challenges from a series of protests that disrupted the network (for example by Insulate Britain, on the M25). It faced separate (unrelated) issues around the Port of Dover.
- Overall, in 2021-22 National Highways’ primary focus was on the safety of the SRN and the delivery of the government’s smart motorway action plan. In January 2022, following the Transport Select Committee’s (TSC’s) report on the roll-out and safety of smart motorways, the government announced a pause to the construction of all new smart motorways until five years’ worth of safety data for existing smart motorways is available.
- This decision came when National Highways and government were still working through changes to the capital programme following Spending Review 2021 (SR21) that removed £3.5bn from the RIS2 budget. The SR21 changes resulted in a smaller RIS2 delivery portfolio and a reduction in the efficiency target, compared to the requirements that the government set for the company at the start of RP2.
- Alongside these changes, the company worked to improve its asset management maturity and set baselines on all environmental key performance indicators (KPIs) for RP2.
- This overall picture is supported by four key messages.
Key message 1: safety Collapse accordion Open accordion
Safety remains National Highways’ priority. The company is working towards meeting its 2025 commitment and its zero harm ambition by 2040. It must maintain its focus as traffic levels return to normal. The company has made good progress on delivering the safety-focused smart motorway action plan. However, we remain concerned about its ability to deliver the action on faster traffic officer response times to incidents.
- National Highways' forecast for its safety performance in terms of killed or seriously injured (KSI) road users on the SRN is higher than 2020, but below pre-pandemic averages. This forecast indicates that the company is on track to meet its 2025 target of a 50% reduction in people killed or seriously injured on the SRN, compared to the 2005-09 average. This position will not be confirmed until the Department for Transport (DfT) publishes the relevant safety data (STATS19) in autumn 2022.
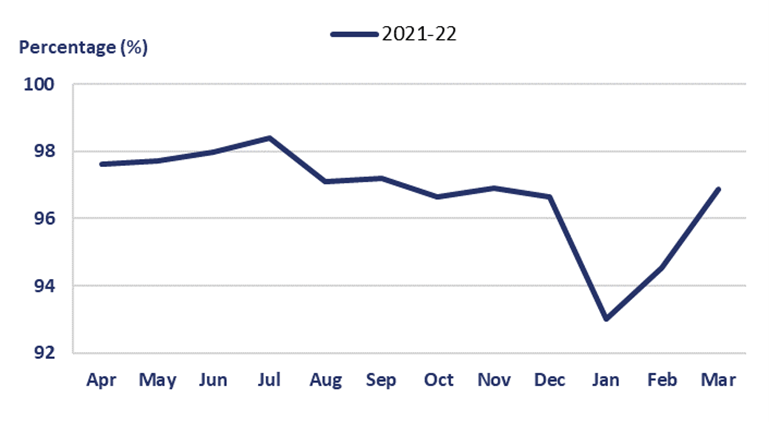
- Traffic on the SRN recovered to 94% of pre-COVID-19 pandemic levels in March 2022, from 68% in March 2021. As road usage and traffic increases, it will be challenging for National Highways to sustain its safety performance and meet its safety targets. Over 2022-23, the company intends to work with government and stakeholders to improve safety and develop an action plan aligned to its 2025 safety target and its 2040 zero harm ambition. We will review this plan.
- A key element of National Highways' safety work is its activity on smart motorways. In particular, the delivery of DfT's safety-focused Smart Motorway Safety Evidence Stocktake and Action Plan. Looking forward, the company will work with us to support DfT to address the TSC’s nine recommendations in its report on the roll-out and safety of smart motorways.
- In 2021-22, National Highways delivered six actions, as scheduled. At year-end 2021-22, the company had completed a total of 15 of the 22 actions. Within the plan, National Highways also set itself a series of milestones and delivery dates for each action.
- Our main safety-related concern throughout 2021-22 was about National Highways' ability to achieve action 3 – faster attendance by traffic officers. This is a critical element in providing visible management of incidents and improving road user safety. The company missed its July 2021 milestone to achieve a 10-minute average traffic officer response to live lane incidents on sections of all lane running motorway with emergency areas more than one mile apart.
- In 2021-22, we required National Highways to provide us with further data and information on its activities. This it did. We also visited the company's regional operations centres. These visits gave us insight and understanding as to how the company is managing response times locally. It has helped to improve our relationships across the business and built confidence in the company’s performance.
- At the time of writing, the average traffic officer response time was 10m 45s. We continue to engage with and hold the company to account to ensure that it does everything that can be reasonably expected of it to achieve its September 2022 target and sustain its performance.
- We will hold the company to account for how it uses international road assessment programme (iRAP) star ratings in more areas of its business (ratings are based on road inspection data and provide a simple and objective measure of the level of safety that is ‘built-in’ to the road for all road users).
Key message 2: asset management Collapse accordion Open accordion
During 2021-22, we saw some progress in National Highways' asset management maturity. However, the company is yet to provide us with sufficient evidence that it is executing its asset management policy consistently and effectively. The renewals work it delivers must be targeted at the right asset at the right time in its lifecycle. National Highways must urgently take steps to demonstrate compliance with its own policy. It must provide us with assurance that it is not compromising the long-term efficiency of its network or road user benefits when taking asset management decisions.
- In 2021-22 we saw an increase in National Highways’ focus on asset management. However, the company is still developing its maturity as an asset management organisation, including how it renews its assets. It must improve its asset management renewals capability, and evidence its improvement through reporting. This reporting will provide greater assurance to us that the company is efficiently delivering the right work to the right asset at the right time. This will lead to improved long-term outcomes for road users, for whom safe and reliable journeys are a key priority. This is directly linked to the quality of the highway asset, in particular road surfacing.
- The company published an updated asset management policy in May 2022 and implemented a governance framework. This enables it to make consistent planning and delivery maintenance decisions. However, we are yet to see sufficient evidence that the company is delivering that policy effectively and consistently in the asset renewals work it delivers across the country.
- National Highways’ current reporting shows that it met its road surface condition KPI target in 2021-22. It also shows how many asset renewals the company delivered and the money that it spent. However, this does not adequately convey whether the company is addressing the right asset need, at the right time. For example, National Highways delivered an output of 566.5 kilometres of safety barrier, against its planned output of 384.6 kilometres. However, we do not know if that was the right asset to invest in and/or if it was the right time to do it. Incorrect investment decisions will result in inefficiencies and reduced road user benefits in the future.
- In our 2020-21 annual assessment, we described the work we had done with the company to trial reporting that showed the extent to which it delivered planned renewals schemes and the reasons for changes across a region. Between April 2021 to March 2022, the company provided limited data for two further regions and was unable to provide sufficient detail and evidence across the whole of its network. The company is now creating a digital tool to help satisfy its renewals reporting requirement.
- However, we are yet to be convinced that National Highways fully understands our ongoing concern about its renewals asset management capability and how it can effectively demonstrate that going forwards. We will assess the roll-out of the company’s new digital tool and hold it to account for how it develops its renewals asset management reporting. The company needs to demonstrate the long-term value it is adding from its asset management capability, through the capital renewals work it delivers.
Key message 3: environmental performance Collapse accordion Open accordion
National Highways' performance against its environmental targets is varied. In 2021-22 the company made good progress with its corporate carbon, noise, and air quality targets. However, we are concerned that it does not have a robust plan to achieve its target of no net loss in biodiversity by 2025. We require the company to provide evidence it is working quickly to rectify this and produce a robust plan.
- In 2020-21, National Highways made good progress on its RIS2 commitments to reduce corporate carbon emissions by 75%, mitigate noise impacts on 7,500 households, and bring air quality on sections of its network into compliance with legal limits in the shortest possible time. The company will need to sustain its performance over the remainder of RP2 to meet these targets.
- However, we have challenged National Highways on its biodiversity delivery programme. We want to ensure that it is accurate, deliverable and will achieve the company's KPI target of no net loss in biodiversity by 2025. At the end of 2021-22, the company forecast a biodiversity net loss by 2025. Given this, and additional future impacts linked to enhancements funding and/or scheme schedule changes, we require National Highways to provide sufficient evidence that it is working quickly to rectify this position. We want to see a robust plan from the company by September 2022 setting out how it will achieve the KPI target by the end of RP2.
- We will continue to scrutinise and challenge National Highways’ environmental plans and processes for delivering ongoing improvements and to meet the new requirements in the Environment Act 2021. We will report back on the company's progress in our 2022-23 annual assessment.
Key message 4: enhancements Collapse accordion Open accordion
National Highways faced several challenges in 2021-22, but it met its in-year revised delivery commitments to start work on four schemes and open for traffic seven schemes. The company faces ongoing risks to delivery, such as planning issues, and needs to demonstrate that it is mitigating these. Otherwise, it will be challenging for it to deliver the remainder of its enhancements portfolio and other commitments on time and to budget, with the appropriate efficiency savings.
- In our 2020-21 annual assessment, we reported on the delivery risks to National Highways’ RIS2 enhancements portfolio caused by planning issues (particularly Development Consent Orders, or DCOs) and the accompanying underspend for RP2.
- Some aspects of these ongoing risks are not directly within National Highways’ control. However, it will need to mitigate them by engaging closely with stakeholders and the Planning Inspectorate to efficiently deliver the remainder of the RIS2 enhancements portfolio and its other commitments on time and to budget.
- In the first quarter of 2022-23, the Secretary of State approved four DCOs, three of which had progressed through the six-week period during which the decision may be legally challenged.
- We will continue to hold National Highways to account for its enhancements delivery, ensuring that it appropriately manages planning-related delivery risks across the remainder of RP2.
Looking ahead to 2022-23 Collapse accordion Open accordion
- Throughout 2022-23 we will maintain a focus on the issues discussed in this report. We will report back on in these matters in our 2022-23 annual assessment. In particular:
- We will publish a report on National Highways’ safety performance later in 2022. It will set out the company’s performance against its safety KPI.
- On the safety of smart motorways, we will continue to hold National Highways to account to deliver the smart motorway action plan, including the 10-minute traffic officer response time by September 2022. We will work with DfT and the company to deliver the recommendations from the TSC’s report on the roll-out and safety of smart motorways.
- On asset management, we will continue to challenge National Highways in RP2 and through our advice to government on the development of the third road investment strategy (RIS3). We will hold the company to account for the roll-out of its new renewals reporting tool by September 2022.
- We will continue to challenge National Highways to produce a robust biodiversity plan by September 2022 to achieve its RP2 KPI target.
- National Highways must ensure that its enhancements programme remains deliverable. We will continue to hold the company to account to ensure that it is doing everything it reasonably can to deliver its commitments.
- We will require National Highways to address the most serious financial risks it faces in 2022-23 and across the remainder of RP2, including how it utilises its Central Risk Reserve.
- We expect National Highways to improve its reporting of efficiency evidence in 2022-23 and place a greater focus on its forecast performance against its KPI. We will scrutinise the company’s progress in this area.
- We will examine how National Highways manages delay on its roads that serve ports and airports. This could include the impact of disruption on the network if post-EU exit border controls on goods entering the country are phased in.
- With the strategic roads user survey (SRUS) target suspended for 2022-23, the third year in a row, we will work with National Highways and Transport Focus on the reintroduction of a target for 2023-24.
- We will hold the company to account for its progress in delivering its designated fund projects across the remainder of RP2.
- In 2022-23, National Highways will start preparing its RIS3 draft Strategic Business Plan. We expect the quality of the company’s plans to reflect its maturity as a company entering the RP3. In summer 2022 we will set out guidance on the evidence we expect National Highways to include in its draft plan and will continue to work closely with the company, and other key parties, to ensure the success of the RIS3 process.
KPIs and targets Collapse accordion Open accordion
- The content below summarises National Highways’ 2021-22 performance against its KPIs and targets.
Outcome: Improving safety for all
KPI and target
- Killed or seriously injured (KSI) - 50% reduction by end of 2025 compared to 2005-2009 baseline
- 2021-22 performance: 1,397 KSI in 2020, a 54% reduction on the baseline. The forecast indicates that National Highways is on track to meeting its target. DfT will publish 2021 data in autumn 2022.
Outcome: Fast and reliable journeys
KPI and target
- Average delay - No worse than 9.5 seconds per vehicle mile
- 2021-22 performance: National Highways met its target. Average delay was 8.8 seconds per vehicle mile.
- Network availability - Not to exceed 43 million in 2021-22
- 2021-22 performance: National Highways met its target. Network availability was 42.7 million, a metric based on the length and impact of roadworks.
- Incident clearance rate - 86% of motorway incidents impacting on traffic flow cleared within one hour
- 2021-22 performance: National Highways met its target. 87.1% of incidents were cleared within one hour.
Outcome: A well-maintained and resilient network
KPI and target
- Pavement condition - 95% of road surface does not require further investigation
- 2021-22 performance: National Highways met its target. 95.5% of road surface did not require further investigation.
Outcome: Delivering better environmental outcomes
KPI and target
- Noise - 7,500 households mitigated in noise important areas by the end of RP2
- 2021-22 performance: National Highways is on track to meet its target. The company mitigated 1,067 households. It has achieved 42% of its RP2 target after two years.
- Biodiversity - No net loss of biodiversity by the end of RP2
- 2021-22 performance: National Highways is not on track to meet its target. The company has forecast a net loss by the end of RP2.
- Air quality - Bring links (sections of SRN between junctions) into compliance in the shortest time possible
- 2021-22 performance: 31 links exceed legal levels for nitrogen dioxide. DfT accepted 17 links have no additional mitigation available. Nine links are forecast to become compliant this year. Updated data is expected by the end of 2022.
- Corporate carbon - 75% reduction in corporate CO2 by 2025 compared to 2017-18
- 2021-22 performance: National Highways is on track to meet its target. The company has reduced its carbon emissions by 59% compared to the baseline.
Outcome: Meeting the needs of all road users
KPI and target
- Road user satisfaction - Target suspended for 2021-22
- 2021-22 performance: Target suspended.
- Roadworks information - 90% of overnight road closures correctly notified 7 days in advance
- 2021-22 performance: Based on the rate of improvement from 2020, National Highways is on track to meet its target. The company reported 68.1% of overnight road closured accurately 7 days in advance.
Outcome: Achieving efficient delivery
KPI and target
- Total efficiency - £2.11bn of operational and capital expenditure efficiency by the end of RP2
- 2021-22 performance: National Highways has reported a total of £502m efficiency savings, ahead of its plan. However, it needs to improve evidence supporting its claim.
1. Key message: safety
Safety remains National Highways’ priority. The company is working towards meeting its 2025 commitment and its zero harm ambition by 2040. It must maintain its focus as traffic levels return to normal. The company has made good progress on delivering the safety-focused smart motorway action plan. However, we remain concerned about its ability to deliver the action on faster traffic officer response times to incidents.
1.1 National Highways' forecast for its safety performance in terms of killed or seriously injured (KSI) road users on the strategic road network (SRN) is higher than 2020, but below pre-pandemic averages. This forecast indicates that the company is on track to meet its 2025 target of a 50% reduction in people killed or seriously injured on the SRN, compared to the 2005-09 average. This position will not be confirmed until the Department for Transport (DfT) publishes the relevant safety data (STATS19) in autumn 2022.
1.2 Traffic on the SRN recovered to 94% of pre-coronavirus (COVID-19) pandemic levels in March 2022, from 68% in March 2021. As road usage and traffic increases, it will be challenging for National Highways to sustain its safety performance and meet its safety targets. Over 2022-23, the company intends to work with government and stakeholders to improve safety and develop an action plan aligned to its 2025 safety target and its 2040 zero harm ambition. We will review this plan.
1.3 A key element of National Highways' safety work is its activity on smart motorways. In particular, the delivery of DfT's safety-focused Smart Motorway Safety Evidence Stocktake and Action Plan. Looking forward, the company will work with us to support DfT to address the TSC’s nine recommendations in its report on the roll-out and safety of smart motorways.
1.4 In 2021-22, National Highways delivered six actions, as scheduled. At year-end 2021-22, the company had completed a total of 15 of the 22 actions. Within the plan, National Highways also set itself a series of milestones and delivery dates for each action.
1.5 Our main safety-related concern throughout 2021-22 was about National Highways' ability to achieve action 3 – faster attendance by traffic officers. This is a critical element in providing visible management of incidents and improving road user safety. The company missed its July 2021 milestone to achieve a 10-minute average traffic officer response to live lane incidents on sections of all lane running motorway with emergency areas more than one mile apart.
1.6 In 2021-22, we required National Highways to provide us with further data and information on its activities. This it did. We also visited the company's regional operations centres. These visits gave us insight and understanding as to how the company is managing response times locally. It has helped to improve our relationships across the business and built confidence in the company’s performance.
1.7 At the time of writing, the average traffic officer response time was 10m 45s. We continue to engage with and hold the company to account to ensure that it does everything that can be reasonably expected of it to achieve its September 2022 target and sustain its performance.
1.8 We will hold the company to account for how it uses international road assessment programme (iRAP) star ratings in more areas of its business (ratings are based on road inspection data and provide a simple and objective measure of the level of safety that is ‘built-in’ to the road for all road users).
Outcome: improving safety for all Collapse accordion Open accordion
1.9 National Highways has one targeted key performance indicator (KPI), five performance indicators (PI) and two commitments under this outcome area.
KPI: number of people killed or seriously injured on the SRN
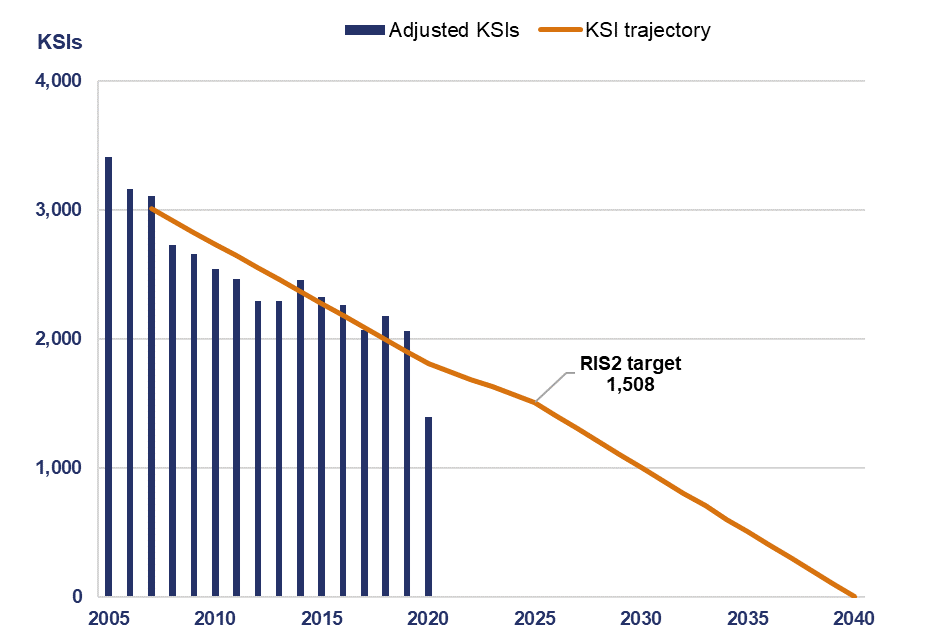
1.10 As detailed in our November 2021 safety update, National Highways met its first road period (RP1) target to reduce the number of people killed or seriously injured on its network by 40% by 2020, compared to 2005 to 2009 levels. STATS19 reported an overall reduction of 52%. Figure 1.1 shows that in 2020 1,397 people were killed or seriously injured on the SRN. This number is adjusted to account for different reporting between police forces. Further details on adjusted data are available in our autumn 2021 safety update.
1.11 National Highways’ estimate for people killed or seriously injured in 2021 shows an increase compared to 2020. However, it is still fewer than the number that the company reported before the pandemic. The company has three years left in which to reach its 50% reduction target. If the company maintains this trajectory, then it would be on track to meet its target. DfT will publish STATS19 to validate this position in autumn 2022.
Figure 1.1 National Highways’ safety performance and target trajectory
PIs: improving safety for all
1.12 PIs are untargeted metrics. They enable us to scrutinise more aspects of National Highways’ network performance beyond the headline KPIs.
1.13 All injury and collision PIs (paragraphs 1.14-1.16) are based on STATS19 data. We are reporting on data for 2020, where injuries and collisions were below pre-pandemic levels due to lower levels of traffic on the SRN. Data for 2021 will be published by government in autumn 2022.
Total number of people killed or injured on the SRN
1.14 The most recently published data shows that in 2020, 7,873 people were killed or injured on the SRN. This PI includes the ‘slight injury’ category that is excluded from the KPI.
Number of non-motorised and motorcyclist users killed or injured on the SRN
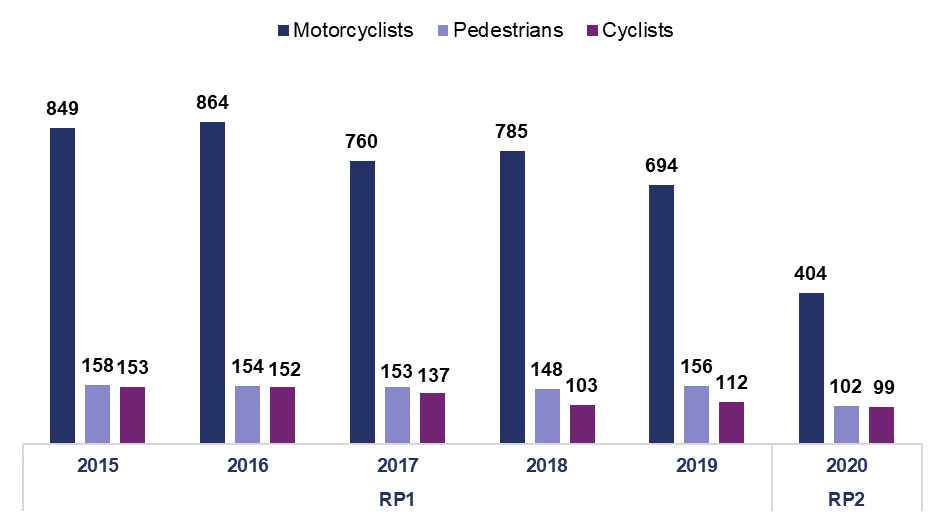
1.15 In 2020, a total of 605 non-motorised and motorcyclist users were killed or injured on the SRN. Figure 1.2 shows a breakdown by user type.
Figure 1.2 Number of non-motorised and motorcyclist users killed or injured on the SRN
Number of injury collisions on the SRN
1.16 In 2020, 5,267 collisions were recorded on the SRN that resulted in at least one injury of any severity. This is a new indicator for RP2. It differs to the PI on number of people killed or injured as it reports the number of collision incidents only.
Accident frequency rate for National Highways’ staff and supply chain
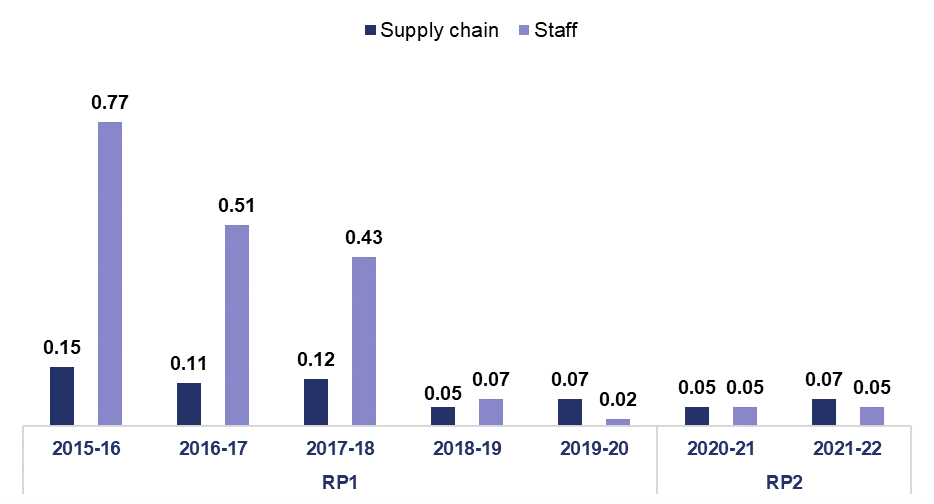
1.17 For National Highways’ staff, there were seven RIDDOR (Reporting of Injuries, Diseases and Dangerous Occurrences Regulations 2013) reportable incidents on the SRN in 2021-22. This equates to an accident frequency rate of 0.05 reportable incidents per 100,000 hours worked (the same as 2020-21).
1.18 For National Highways’ supply chain, there were 27 RIDDOR reportable incidents. This equates to 0.07 incidents per 100,000 hours worked. This is higher than 2020-21 when the incident rate was 0.05.
1.19 Figure 1.3 shows an improvement in overall accident frequency rates since 2015. However, improvements have stalled in RP2, with the supply chain accident frequency rate rising back to the same level as 2019-20.
Figure 1.3 Accident frequency rate for National Highways’ supply chain and staff
Percentage of traffic using iRAP 3-star or above rated roads
1.20 iRAP is a way to measure how safe a road network is. This is done with a 5-star rating for each section of road. The roads with the highest risk to road user safety are rated one star and roads with the lowest risk are rated five stars.
1.21 National Highways committed in RIS1 to ensure that by the end of 2020, 90% of travel on the SRN was on roads rated three stars or better (using model v1). The company conducted a survey and published a report in March 2022 indicating that 96% of travel on the SRN was on roads rated three stars or better in the iRAP model, exceeding its RIS1 target.
1.22 iRAP introduced an updated model (v3.02) following several years of development. It has more demanding requirements for 3-star roads as it includes ten times as many attributes to record, such as pedestrian and cyclist flows.
1.23 In its report, National Highways said that by the end of 2020, 89% of travel on the SRN was on roads rated three stars or better against the v3.02 model. This was an improvement compared to 82% of travel in 2015 that would have been on 3-star roads under that model.
1.24 We will review National Highways’ use of iRAP data in more parts of its business, such as enhancements design, walking and cycling schemes and road upgrades. This is to satisfy ourselves that the company is using the data effectively to improve safety on the network.
Commitments: improving safety for all
1.25 Commitments are priorities that are not suited to metrics, such as developing new metrics, publishing reports on specific performance items or improving reporting for future years.
In 2021 establish an iRAP baseline and 2025 forecast, based on latest iRAP methodology
1.26 National Highways has met this commitment (see paragraph 1.21). The company is forecasting that 89% of travel in 2025 will be on roads rated three stars or better against the v3.02 model. The company has explained that this is unchanged from the 2020 baseline because it is undertaking network improvements to reduce risks on 3, 4 and 5-star rated roads.
Work with Transport Focus to investigate a rate-based measure for non-motorised user casualties
1.27 In April 2022, government approved National Highways’ request to cease the development of a rate-based measure for non-motorised user casualties. This was due to difficulties gathering the required data.
Safety of smart motorways Collapse accordion Open accordion
1.28 We hold National Highways to account for the delivery of the safety-focused smart motorway action plan. In January 2022, government agreed to take forward the TSC’s nine recommendations on the roll-out and safety of smart motorways. We are working with government and the company to implement and deliver the recommendations.
1.29 In October 2019, the Secretary of State (SofS) asked DfT to carry out an evidence stocktake of smart motorway safety. The report was published in March 2020, as the Smart Motorway Safety Evidence Stocktake and Action Plan. The SofS asked us to hold National Highways to account for the delivery of these actions. The company has since published two annual progress reports, with the second year progress report published in May 2022. For each action, it set itself a series of milestones and delivery dates. These progress reports also contain safety data for specific types of smart motorway that we independently quality assured.
Delivery of the smart motorway action plan
1.30 In 2021-22, National Highways completed six of the 22 actions in the plan. The company reported that it did the following:
- evaluated live lane stops to see if additional M25 emergency areas had reduced the rate;
- investigated accident clusters and implemented changes where necessary;
- contributed to the update of the Highway Code;
- communicated with road users on using smart motorways;
- created a national programme to install more emergency areas on existing smart motorways; and
- enabled satnav providers to show places to stop in an emergency.
1.31 National Highways completed nine actions in 2020-21 and it plans on delivering five actions in 2022-23. This would leave one action for the company to deliver between 2023 and 2025 to meet its commitments. Table 1.1 lists all outstanding actions.
1.32 In January 2022, National Highways paused delivery against its action to end the use of dynamic hard shoulders (DHS). This followed government’s decision to pause the upgrade of these motorways to ALR in response to recommendation eight of the TSC’s November 2021 report on the roll-out and safety of smart motorways.
Table 1.1 Outstanding actions against the smart motorway action plan
| Action | Action completion date |
|---|---|
| Ending the use of DHS (upgrade of DHS to ALR) | Paused following TSC recommendations |
| Faster roll-out of stopped vehicle detection (SVD) | September 2022 |
| Faster attendance by traffic officers where emergency area (EA) spacing is more than one mile | March 2023 |
| Monitor smart motorway performance | March 2025 |
| More traffic signs giving the distance to the next place to stop in an emergency | September 2022 |
| Displaying 'report of obstruction' messages | March 2023 |
| Complete upgrade of enforcement cameras (HADECS3) to enforce Red X | September 2022 |
1.33 National Highways also created seven follow-on actions. The company judged follow on actions to be necessary to either complete a main action or because of a main action. It completed four of these actions on time in 2021-22. Table 1.2 lists the follow-on actions and their completion dates.
Table 1.2 Smart motorway action plan: follow-on actions
| Follow-on actions | Follow-on action completion date |
|---|---|
| Smart motorways in construction will open with SVD | September 2022 |
| Evaluation of live lane stop rates to see if additional M25 EAs have reduced the rate | Complete (February 2022) |
| Deliver a programme of measures identified to enhance the safety across the four locations | March 2023 |
| Making emergency areas more visible - follow on activity | Complete (June 2021) |
| Launch eCall public information campaign | Complete (September 2021) |
| Identify and deliver a programme of works for widening EAs identified as being feasible and appropriate | March 2025 |
| Use the Driving for Better Business campaign to urge businesses to always switch on Automatic Emergency Braking to reduce likelihood of rear end collisions involving lorries. | Complete (February 2022) |
Pausing the roll-out of smart motorways
1.34 As set out in paragraph 1.28, government accepted the TSCs recommendation to pause the roll-out of smart motorways until five-years of safety data is available to evaluate the safety of smart motorways introduced before 2020.
1.35 National Highways has a standardised method of post opening project evaluations (POPEs) for enhancements schemes. A POPE evaluates the actual impact of a scheme compared to expected impacts. The company currently evaluates each scheme it delivers at the one- and five-year milestones after it opens for traffic.
1.36 We are scrutinising the company’s POPE publication plan for smart motorway schemes. Nine of these are due to be completed in 2022. In July 2021, the company published the five-year POPE for the M1 junctions 10 to 13 dynamic hard shoulder running scheme.
1.37 It is imperative that National Highways improves its delivery timescales of POPEs. This would enable the company to provide five-years of safety data evidence and properly evaluate smart motorway schemes in-line with the TSCs accepted recommendation.
Traffic officer 10-minute response time
1.38 Action 3 of the smart motorway action plan is for faster attendance by National Highways traffic officers. In March 2021, the company set a milestone of July 2021 to achieve a 10-minute average response time for traffic officers responding to live lane stops on sections of ALR where places to stop in an emergency are more than one mile apart.
1.39 In May 2021, we commissioned an external review of five critical smart motorway actions. The review, published in August 2021, made recommendations on how we should hold National Highways to account for its delivery against the action plan. It concluded that a metric for traffic officer response times would help us to measure the company’s progress.
1.40 National Highways missed its July 2021 milestone. We escalated our concerns. We wrote to the company on 13 August 2021 to request additional disaggregated regional data on the following three areas:
- the staffing levels it needs to meet the 10-minute response time and an assessment of how existing levels compared;
- its traffic officer recruitment, absence and attrition rates; and
- its performance against the 10-minute response time.
1.41 National Highways responded to our letter on 18 August 2021. It began to send us the requested data monthly from September 2021 onwards. We have been using this information, alongside our regular engagement, to hold National Highways to account for its delivery of the action.
1.42 We wrote to National Highways again on 13 January 2022 following the company's failure to provide a revised milestone date and to reflect our ongoing concerns about the company’s ability to achieve the action. National Highways responded to our letter on 19 January 2022 setting out:
- a new target date of September 2022 to achieve the milestone;
- a list of 'levers' that it intended to deploy for each of its regions to achieve the action, together with the likely impacts of these levers across each region, based on a high, medium and low assessment;
- its plan to assess the success of these levers at weekly and monthly review meetings both regionally and nationally;
- recognition that the labour market was challenging, and the company had difficulty with recruitment in certain regions;
- that the two largest risks to achieving the target time will be the acceptance of single vehicle crewing and the delivery of additional traffic officer vehicles; and
- a detailed programme for the roll-out of an updated incident management system for the ROCs, and SVD, a system of radar technology that can detect a stopped vehicle in a live lane.
1.43 After receiving this information from National Highways, we visited each of the company’s ROCs. We talked to senior staff at each ROC to better understand what the company is doing to improve response times and the issues and risks to achieving the 10-minute response target. We discuss this further in the case study.
Case study: ORR visits to Regional Operations Centres (ROCs)
National Highways deals with around 1,500 reports of incidents on the strategic road network (SRN) on a typical day. Approximately 200 daily incidents impact a live lane. One in four of these are on smart motorways and are included in the company’s 10-minute response time target.
National Highways manages incidents from its ROCs, where operators answer calls from road users and emergency services and dispatch traffic officers to assist. Since November 2021, when the company reported average response times of 11m 35s, we have visited all the company’s ROCs. We arranged these visits to understand what it was doing on a regional basis to reduce traffic officer response times.
National Highways employs around 900 traffic officers who patrol the SRN, and 400 ROC operators. On the visits we challenged the company to provide further details of its recruitment processes and existing vacancies. Staff told us that the company had moved to a modular training process. This enabled it to fill vacancies faster. This gave us confidence that the company was managing its staffing levels in a way that would help it reach its 10-minute response time target.
We saw each region’s patrol strategies. These are designed to achieve the fastest possible response time by allowing for variations in time of day and traffic flows. The company uses a bottom-up approach, where traffic officers input their thoughts on the strategy. This level of maturity increased our confidence that regional teams are taking steps to reduce their local response times.
We saw stopped vehicle detection in operation. The control room is alerted when a stopped vehicle is detected on a section of all lane running (ALR). It also sets a ‘report of obstruction’ sign for drivers. The system automatically displays a camera feed facing the detected vehicle. ROC operators then acknowledge the alert and either confirm it is a stopped vehicle or remove the alert if it was a false alarm. If a stopped vehicle is confirmed, the signs and signals are set automatically, with speed limit changes and a lane closure if required. Traffic officers are then dispatched to attend the stopped vehicle.
Our visits allowed us to further understand how National Highways is using technology, ROC operators and traffic officers to achieve its 10-minute response time target. We will continue to assess the company’s progress. What we saw on the visits will also be useful for our future work in this area.
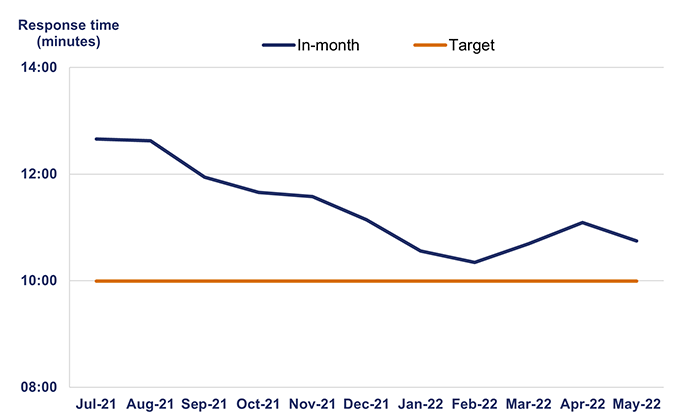
1.44 In May 2022, National Highways averaged 10m 45s for traffic officers responding to live lane stops on sections of ALR where places to stop in an emergency are more than one mile apart. This is an improvement from when the company started reporting response times to us in July 2021. Figure 1.4 shows the monthly changes in performance.
1.45 Between July 2021 to February 2022, National Highways improved its performance. This was due to improved patrol strategies, some additional traffic officer vehicles and recruiting traffic officers and ROC staff.
1.46 We scrutinised National Highways’ calculation of its traffic officer response times. Data before October 2021 had errors present for certain regions. The company fixed these errors and we are now satisfied that the data we receive is accurate and robust.
Figure 1.4 National Highways’ traffic officer response times
1.47 National Highways has told us that the two most significant risks to meeting its 10-minute target in September 2022 are:
- slower delivery and fitting out of new traffic officer vehicles, caused by supply chain issues during 2022; and
- the activation of Operation Brock.
1.48 National Highways is reporting that its roll-out of new traffic officer vehicles is running at half the expected rate. This is due to supply chain issues in importing the vehicles and associated equipment. The company is prioritising delivery of vehicles to regions that have higher average response times to help lower the average nationally.
1.49 Operation Brock was activated on 25 March 2022 and deactivated on 6 June 2022. The traffic management that forms part of the operation draws traffic officers from other parts of the network. This increased response times nationally. It was reactivated on 11 July 2022. The latest activation is likely to adversely affect traffic officer response times. The case study that follows discusses our visit to see Operation Brock and its impact on the 10-minute response target.
1.50 Based on National Highways’ June 2022 data, it has fewer traffic officers in recruitment and training, relative to the number of vacancies. However, the company has modularised its training programme and streamlined recruitment. This is likely to lead to faster on-boarding with no loss of competence.
1.51 We think that the revised milestone target date, of September 2022, is achievable if National Highways continues delivering additional traffic officer vehicles and focuses on recruitment of traffic officers. However, the activation of Operation Brock will negatively affect performance and the company will need to mitigate its effects successfully if it is to achieve the target. We will continue to closely scrutinise National Highways’ delivery of this milestone.
Case study: ORR visit to Operation Brock
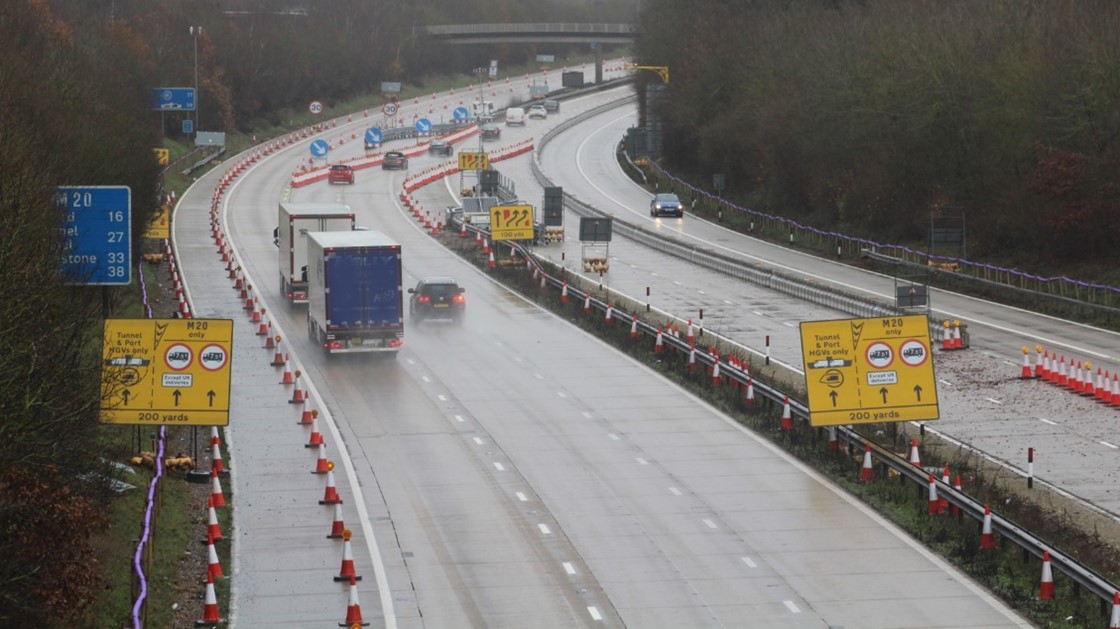
Operation Brock is a traffic management measure designed to improve the resilience of the strategic road network (SRN) in the event of disruption to travel across the English Channel. It operates along a 10-mile stretch of the M20 in Kent, between Junctions 8 and 9. It enables National Highways to control the flow of continental Europe-bound lorries and manage lorry traffic on the SRN.
The Kent Resilience Forum, of which National Highways is a part, decides when to activate Operation Brock. We visited the control centre in May 2022 to understand the scale of the operation and the impact on smart motorway response times.
On our visit we saw National Highways’ constraints when operating the network in Kent and the lack of spare capacity to accommodate lorry traffic. This enabled us to understand the context for how the company deploys its traffic officers to run Operation Brock.
We discussed Operation Brock staffing requirements, the associated redeployment of traffic officers across the South-East and other regions, and the impact this had on the region’s 10-minute response time. The company also told us how it is driving continuous improvement by enabling traffic officers to patrol the carriageway in both directions.
We will continue to assess the impact of Operation Brock on traffic officer response times and challenge the company to improve its regional resilience when it is active.
Source: National Highways
2. Key message: asset management
During 2021-22, we saw some progress in National Highways' asset management maturity. However, the company is yet to provide us with sufficient evidence that it is executing its asset management policy consistently and effectively. The renewals work it delivers must be targeted at the right asset at the right time in its lifecycle. National Highways must urgently take steps to demonstrate compliance with its own policy. It must provide us with assurance that it is not compromising the long-term efficiency of its network or road user benefits when taking asset management decisions.
2.1 In 2021-22 we saw an increase in National Highways’ focus on asset management. However, the company is still developing its maturity as an asset management organisation, including how it renews its assets. It must improve its asset management renewals capability, and evidence its improvement through reporting. This reporting will provide greater assurance to us that the company is efficiently delivering the right work to the right asset at the right time. This will lead to improved long-term outcomes for road users, for whom safe and reliable journeys are a key priority. This is directly linked to the quality of the highway asset, in particular road surfacing.
2.2 The company published an updated asset management policy in May 2022 and implemented a governance framework. This enables it to make consistent planning and delivery maintenance decisions. However, we are yet to see sufficient evidence that the company is delivering that policy effectively and consistently in the asset renewals work it delivers across the country.
2.3 National Highways’ current reporting shows that it met its road surface condition key performance indicator (KPI) target in 2021-22. It also shows how many asset renewals the company delivered and the money that it spent. However, this does not adequately convey whether the company is addressing the right asset need, at the right time. For example, National Highways delivered an output of 566.5 kilometres of safety barrier, against its planned output of 384.6 kilometres. However, we do not know if that was the right asset to invest in and/or if it was the right time to do it. Incorrect investment decisions will result in inefficiencies and reduced road user benefits in the future.
2.4 In our 2020-21 annual assessment, we described the work we had done with the company to trial reporting that showed the extent to which it delivered planned renewals schemes and the reasons for changes across a region. Between April 2021 to March 2022, the company provided limited data for two further regions and was unable to provide sufficient detail and evidence across the whole of its network. The company is now creating a digital tool to help satisfy its renewals reporting requirement.
2.5 However, we are yet to be convinced that National Highways fully understands our ongoing concern about its renewals asset management capability and how it can effectively demonstrate that going forwards. We will assess the roll-out of the company’s new digital tool and hold it to account for how it develops its renewals asset management reporting. The company needs to demonstrate the long-term value it is adding from its asset management capability, through the capital renewals work it delivers.
Outcome: a well-maintained and resilient network Collapse accordion Open accordion
2.6 National Highways has one targeted key performance indicator (KPI), four performance indicators (PI) and two commitments under this outcome area.
2.7 National Highways’ performance against its road surface condition KPI is above target, as it was in the first year of the second road period (RP2). Its overall performance against other metrics within this outcome area continues to show improvement with no significant deterioration in comparison to the previous year.
KPI: road surface condition
2.8 At the end of March 2022, the percentage of lane 1 road surface on the strategic road network (SRN) that did not require further investigation by National Highways was 95.5%. This has been consistent across the last five years and is an improvement of 0.3% on the company’s position at year-end 2020-21.
Figure 2.1 Pavement not requiring further investigation between April 2020 and March 2022 (%)
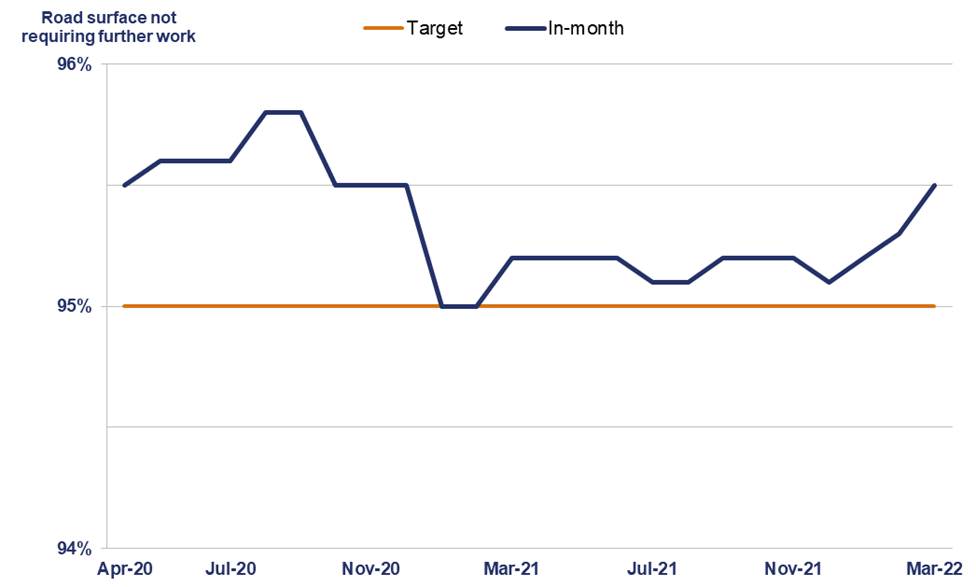
2.9 For the first two years of RP2, only lane 1 (left-hand lane) was considered as part of the KPI. This is because it is the lane most impacted by vehicles, especially lorries. Government and National Highways improved and updated the metric for the remainder of RP2 to include condition data from all the main lanes. This will better represent the overall condition across the network.
PIs: a well-maintained and resilient network
2.10 PIs are untargeted metrics. They enable us to scrutinise more aspects of National Highways’ network performance beyond the headline KPIs.
Structures condition
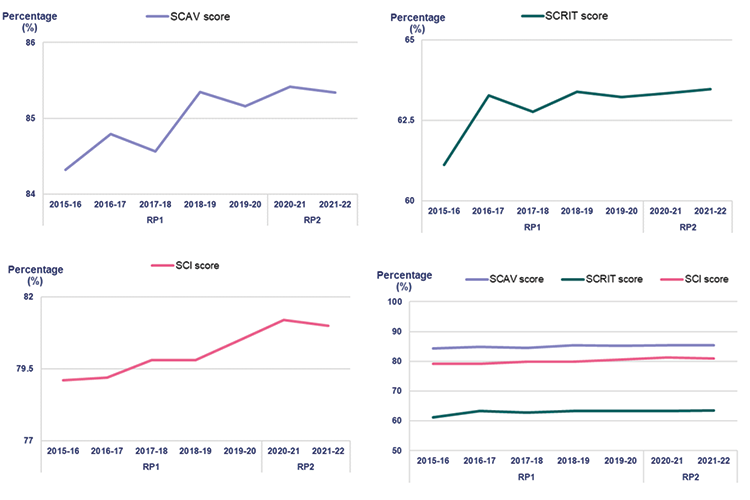
2.11 The condition of structures (for example, culverts, gantries, retaining walls and bridges) is measured by three performance indicators:
- the average condition of the stock (SCAV);
- the condition of the assets’ most critical elements (SCRIT); and
- the percentage of structures that have been inspected and rated as ‘good’ (SCI).
2.12 As shown in figure 2.2, the reported numbers show a continuous increase for SCRIT score and only a slight decline in the SCAV score and SCI score between March 2021 and March 2022. The reduction is less than a 0.5 percentage point difference.
Figure 2.2 Structures PI for RP1 and the first two years of RP2
Technology availability
2.13 This indicator measures the percentage of time that roadside technology assets on the SRN, (for example, cameras, electronic signs and weather stations that observe and control traffic), are available and functioning. National Highways reported that the availability of its technology assets was 96.88% at the end of March 2022. This was an increase of 1.82 percentage points compared to the end of March 2021.
Figure 2.3 Roadside technology assets availability in 2021-22 (%)
Drainage resilience
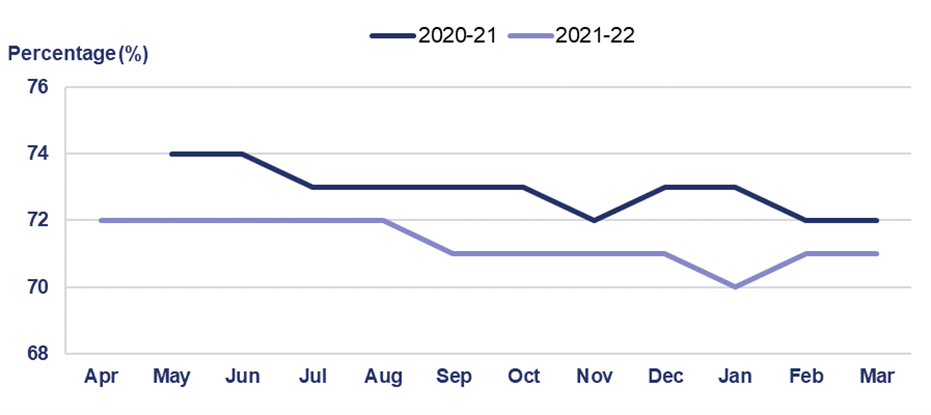
2.14 Drainage assets collect, move or store surface water runoff on the SRN. This indicator measures the percentage length of National Highways’ network that does not have an observed significant susceptibility to flooding. As at March 2022, the company reported drainage resilience of 71%. This was one percentage point lower than March 2021. This means that 29% of the SRN has areas that include high risk flood hotspots.
2.15 National Highways is working to minimise the impact of flooding on the network by improving its reporting process. This is to ensure that:
- in the short-term adequate preventative measures are in place for areas with high-risk flood hotspots when severe weather conditions are expected, such as clearing pipes; and
- in the long-term that remediations where possible are prioritised for the high-risk hotspots, such as replacement of drainage pipework.
Figure 2.4 Percentage length of SRN with no significant susceptibility to flooding in the first two years of RP2
Geotechnical condition
2.16 This PI captures the percentage length of National Highways’ geotechnical assets (earthworks that support other highway assets and adjacent land) that are in ‘good’ condition or better. As at March 2022, the company reported that 99.61% of its geotechnical assets achieved at least a ‘good’ rating. This was 0.01 percentage points lower than in 2021.
Commitments: a well-maintained and resilient network
2.17 Commitments are priorities that are not suited to metrics, such as developing new metrics, publishing reports on specific performance items or improving reporting for future years.
Implement the Asset Management Development Plan (AMDP) for RP2
2.18 Early in the first road period (RP1), National Highways transferred the milestones it had set out in its AMDP into an Asset Management Transformation Programme (AMTP). The company met those milestones for the first year of RP2 (2020-21).
2.19 In 2021-22 the company accelerated two milestones from 2022-23 to increase the total to 14. However, it missed two of these milestones.
2.20 The first of these missed milestones was to develop three metrics:
- ride quality – planned implementation from April 2022 was postponed until September 2022 because of delays to user trials due to the coronavirus (COVID-19) pandemic. Government, ORR, National Highways and Transport Focus agreed to the postponement;
- vulnerable structures – change of scope to align with the company’s RP3 investment case; and
- investigate and improve structures condition – achieved.
2.21 The second missed milestone related to the company’s asset data governance model. The company changed the scope and timescale. It reported that this was to align the activity with existing work on data governance.
2.22 Delivery of the milestones in its AMTP is an important part of how National Highways improves its asset management capability. It is important therefore that the company does not miss those milestones for reasons within its control. Milestone scope changes are appropriate given that they are subject to change control governance within the company. We will look at the milestones that have timescale changes into 2022-23 (ride quality metric and asset data governance model). We want assurance that they have been completed, in addition to those new milestones planned for the year ahead.
Investigate an improved structure condition metric and an alternative indicator for technology assets
2.23 In its year-end reporting, National Highways said that it was on track to deliver this commitment. The company reported that it had met its milestone to complete the feasibility stage of its metric investigations by Q2 2021-22 for both structures and technology assets. It is conducting detailed investigations of the feasibility recommendations into 2022-23.
Maintaining the SRN
2.24 We assess how well National Highways maintains the SRN by analysing the company’s reported data sets. Infrastructure maintenance is typically split into two main categories, determined by the funding source:
- routine maintenance keeps the SRN safe and serviceable by undertaking routine cyclical operations like cutting vegetation, clearing drains and graffiti, and reactive repairs to defects such as potholes. It is funded under resource budgets; and
- renewal of assets such as road surfacing and bridges that make up the SRN. This is funded under capital budgets.
Annex C contains a summary of data sets against each category.
2.25 While separately funded, the two categories are directly linked. If National Highways does not adequately deliver routine maintenance, assets may fail prematurely requiring early renewal, and if the company does not undertake renewal activity in a timely manner an asset may require increased routine maintenance to keep it safe for users. The range of different asset types that form the SRN and the impact of varying traffic levels and environmental conditions across the country make this a complex challenge for the company to manage.
2.26 However, this is a fundamental part of what National Highways’ is expected to do. It makes a significant contribution to how efficient the company is. As a minimum, the company must ensure that the SRN is safe for use and fit for purpose. Maintenance is a major part of the overall asset management system that enables the company to maximise the value of the SRN to users and achieve the strategic requirements of the road investment strategy (RIS). It is therefore important that National Highways demonstrates that it is delivering against its asset management policy, how it is delivering against that policy, and that it is efficiently managing the SRN.
Capital maintenance – renewals planning and delivery
2.27 National Highways delivered all its committed major life-extension renewals, and most of its cyclical renewals in 2021-22. The company failed to meet four of its 14 cyclical renewals commitments:
- it marginally missed commitments in two categories: bridge parapets and technology assets;
- it missed its commitment on bridge waterproofing by 25%; and
- it missed its commitments on lighting by 6%.
The company reported that it missed these commitments mainly because of contractual delays in the Yorkshire and North-East region that transferred to the AD contract model in 2021-22. It is positive that National Highways understands why it under-delivered and has processes in place to offset a shortfall in one region with over-delivery in other regions in-year. However, the Yorkshire and North-East region is one of the last regions to transfer to the AD contract model. We are concerned that lessons learned from earlier transfers did not enable a smoother contract mobilisation.
2.28 Figure 2.5 summarises the major life extension renewals volumes that National Highways delivered against its planned commitments in 2021-22. Annex C provides a full summary of renewals delivery.
Figure 2.5 Volumes of major life-extension renewals delivered compared to plan in 2021-22
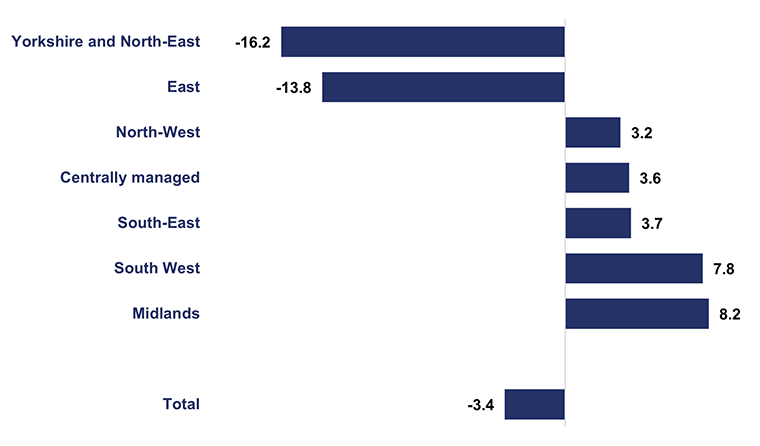
2.29 National Highways spent close to its 2021-22 funding to deliver its planned renewals commitments. Overall, the company underspent by £3.4m (0.4%). This was driven by structures and technology and partially offset by overspends on roads and winter maintenance assets. Regionally there was some variation, ranging from a £16.2m (12%) underspend in Yorkshire and the North-East to a £8.2m (6.6%) overspend in the Midlands. This was due to difficulties in rolling out the new AD approach (see paragraph 2.27).
Figure 2.6 Chart showing renewals expenditure variance by region in 2021-22 (£ million)
2.30 National Highways must deliver key asset renewal volumes in line with RIS2 assumptions, its delivery plans and within its funding. Delivering the RIS2 requirements within funding is an important part of the evidence of performance against the efficiency KPI for all areas of expenditure.
2.31 However, for renewals, we recognise that focusing mainly on volumes and spend can lead the company to take a short-term approach in its decision making. This could mean not always renewing the right assets at the right time in their lifecycle or providing a less complex, lower quality renewal. We saw this in several areas of National Highways’ renewals practice during the first two years of RP2. For example:
- slow delivery of renewals in the early part of 2020-21 and 2021-22 led to higher than planned delivery during the winter months when adverse weather can impact renewal quality (figure 2.7);
- completing ‘life extension’ concrete pavement renewals comprised of localised repairs, in place of full surface reconstruction. The company deferred the more complex and disruptive repairs to later years of RP2; and
- lacking evidence that it is delivering pavement renewals at the average depth levels of 54mm that it was funded to do within RIS2 to achieve reduced whole-life costs.
Figure 2.7 Renewals capital expenditure in 2021-22
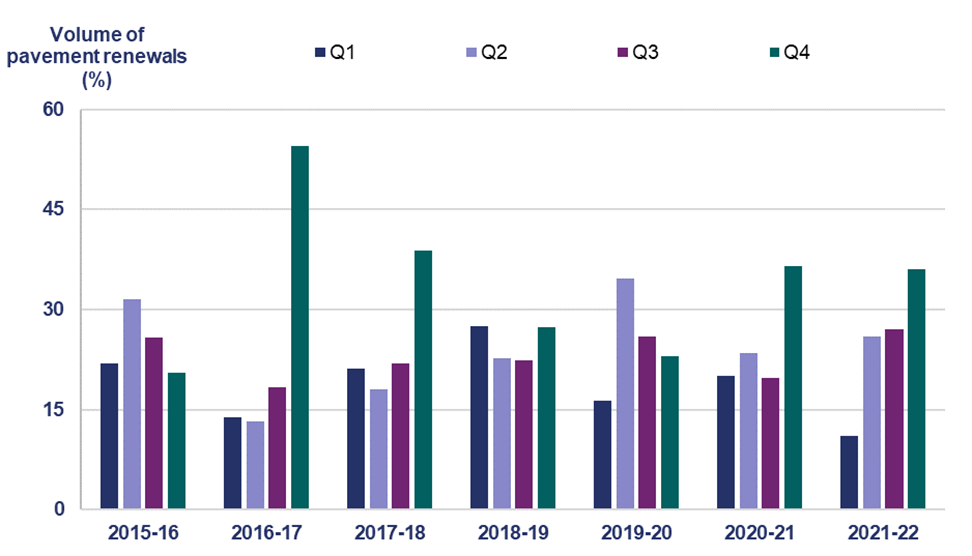
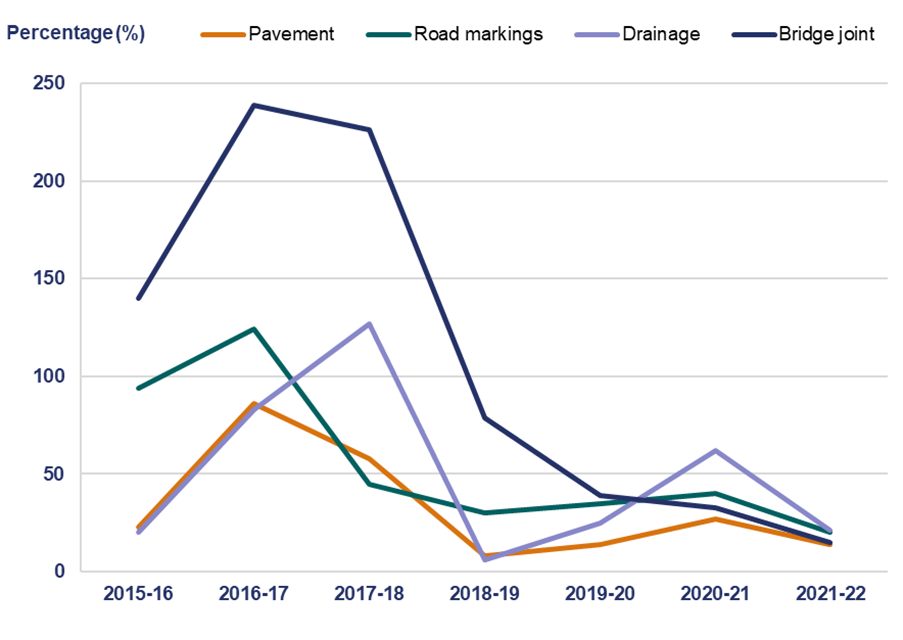
2.32 National Highways’ delivery of renewals in 2021-22 was closer to plan than in the first year of RP2. Fewer assets exceeded 50% output variance from the plan and the company avoided any significant variances from planned outputs. Compared with the early years of RP1, this demonstrates how the company has improved its delivery against its plans. Figure 2.9 shows how delivery of renewals has varied compared to plan since 2015 across a selection of assets.
Figure 2.8 Volumes of renewals delivered compared to plan for a selection of assets between April 2015 and March 2022
2.33 Our main concern with how National Highways reports its renewals outputs and its spend against budget is that it only tells us how many outputs were delivered and how much budget was spent. It does not tell us whether the outputs delivered were against those assets with the greatest need, or what value the company has added to the SRN. It does not tell us whether over-delivery reflects an asset in poorer condition, or whether under-delivery will result in safety risks to the user.
2.34 National Highways should not assume that delivering more outputs for the same money is automatically a good thing. It must seek to understand and report whether its work is addressing the asset need and adding value from a whole-life cost perspective. If the company’s reporting is limited to basic backward-looking counts, it will struggle to meaningfully show the impact of its asset management policy and governance and whether it is addressing the strategic requirements of the RIS, now and in the future.
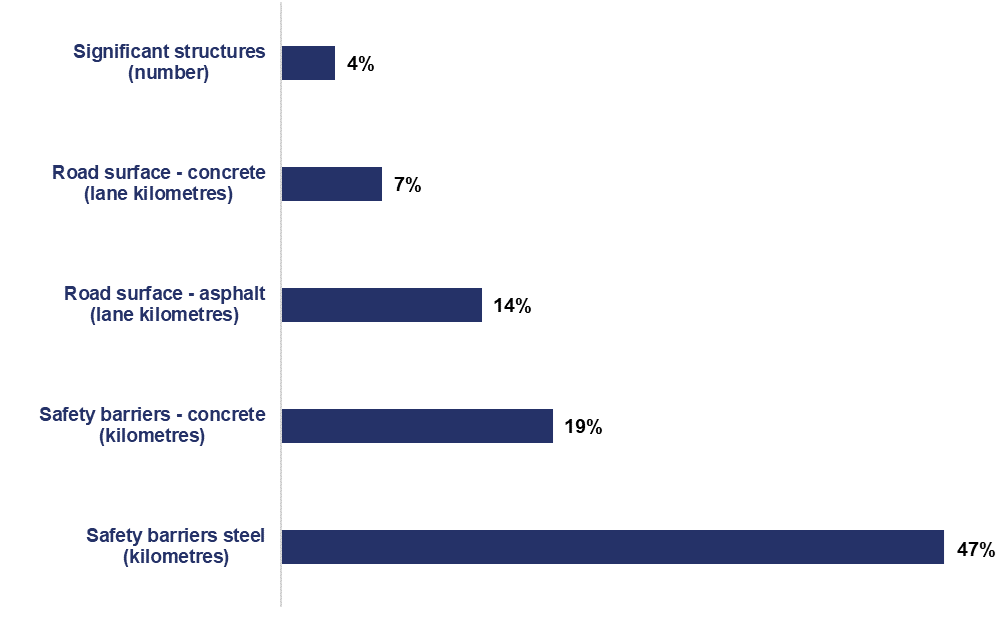
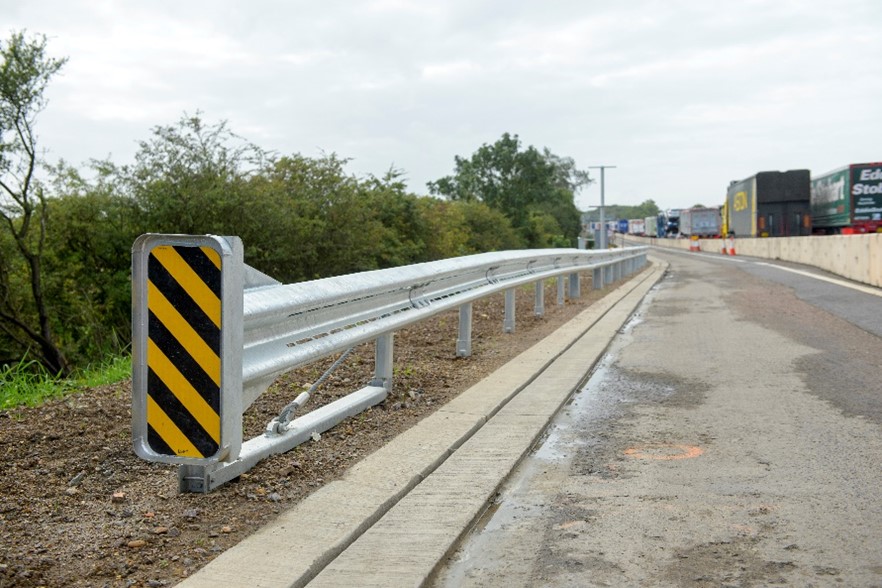
2.35 RIS2 requires National Highways to report asset performance against a range of metrics (see paragraph 2.24 and annex C). This gives us an indication of the health of the SRN and the impact of the maintenance work the company has delivered. However, the company reports only limited aspects of performance and does not include all asset types. For example, the renewal of safety barriers is funded in RIS2 as part of the major life extension renewals programme, yet the company does not report how safety barriers perform. In 2021-22, the company reported that it had delivered 47% more steel, and 19% more concrete safety barriers than it had planned. However, this does not tell us whether this work addressed specific need, whether it improved road user safety or whether it was the best use of resource from a whole-life cost perspective.
2.36 In 2021-22, National Highways reported that contractual delays associated with the roll-out of its AD contract model in the Yorkshire and the North-East region caused a shortfall in the company’s delivery of renewals in that region. However, this was offset by over-delivery elsewhere in the country. National Highways provides us with improved high-level regional commentary on its renewals delivery. This is helpful. However, its focus remains on renewal outputs delivered and spend. It is not possible to determine the impact of the company’s delivery against local asset need across its regions. The company’s reporting must provide assurance that delayed works do not have a detrimental impact on asset need or user risk or increase the requirement for routine maintenance works in regions where plans are disrupted.
2.37 In 2021-22, National Highways planned to deliver its first full reconstruction concrete road surfacing scheme. The company told us that the planned scheme start date was delayed and was reprogrammed to commence in financial year 2022-23. This generated an underspend in the 2021-22 financial year of approximately £70m, so the company brought forward other works to utilise the funding. This adjustment to a complicated programme meant that projects then clashed with the plans of neighbouring highways authorities, preventing the deployment of appropriate traffic management and limiting delivery of those adjusted renewals. National Highways’ reporting must show that it is using the five-year funding window provided by RIS2 to avoid the inefficiency associated with spending annual budgets, and to best manage the whole-life costs of the asset.
2.38 National Highways does not deliver renewals outputs solely through its maintenance schemes. It can also deliver these outputs through other programmes, such as enhancements or designated funds. These programmes typically have different outcome requirements to those of the renewals programme. Therefore, reporting that is focussed on outputs delivered may not necessarily demonstrate well-maintained and resilient network outcomes. It is important that National Highways makes clear in its reporting the value of the maintenance outcomes it achieves from the work it delivers.
Case study: Renewals capability
In August 2021 we commissioned a review of National Highways’ evolving approach to renewals investment planning for RIS3. We investigated six key asset groups that account for most of its expenditure on renewals: road surfaces, barriers, structures, roadside technology, drainage, and geotechnical assets. The review considered the quality of asset condition data, how the company determines whether an intervention is required, and how it balances factors such as traffic disruption, environmental impacts, and cost.
We assessed the maturity of National Highways approach against its own renewals planning capability framework. The framework is a staged process that builds towards the aim of ultimately implementing a ‘Service Value Driven’ approach that seeks to optimise the long-term social value of investment. We support the use of the framework, and the capability targets National Highways has set itself.
Overall, the review found a mixed picture. National Highways had met its own renewals planning capability targets for some assets, but elsewhere it had more to do in terms of the quality of data and evidence available. In 2021-22, the company worked on addressing the gaps identified and has made some progress. For example, the company has shared its plans for how it will enhance its asset knowledge for structures and roadside technology.
An important cross-cutting area of capability highlighted by the review was the extent and sophistication of National Highways’ whole-life cost assessment. This is an area where we would like the company to increase its focus. It is vital that, subject to a range of other considerations, the company plans renewals in a way that minimises the cost of maintaining the network in the long-term. During the RIS3 development process, we expect the company to demonstrate it has a good understanding of its plans.
Resource maintenance – routine maintenance
2.39 National Highways reports maintenance performance against a range of metrics covering core maintenance activities, defect management, asset inspection and insurance claims.
2.40 Throughout RP1 and into RP2, the company has been transitioning legacy maintenance contracts with its supply chain to the Asset Delivery (AD) contract model. Under the AD model, National Highways is in direct control of data collection and associated decision making. We expect the quality of the company’s reporting to improve alongside greater transparency of how it is maintaining the network and the value this is adding to reflect improved capability as the transition to AD nears completion.
2.41 National Highways reported that in 2021-22 it improved cyclical and reactive maintenance performance compared to 2020-21. The company also improved its performance in addressing high priority defects across most defect types, within its 24-hour target. However, its performance in addressing normal defects within the required timescale decreased across most defect types. Furthermore, the company reduced the number of categories it reports defects against in 2021-22. We are concerned that this reduces the transparency of defect management to assets that are important to road users, such as road signage. It also narrows our understanding of the impact National Highways’ maintenance work has made on the range of asset types. Annex C describes the reduced number of categories and defect performance.
2.42 In 2021-22, National Highways overspent its resource maintenance budget by £28m. The company told us that this additional spend is likely to have led to improvements across areas of maintenance performance, but it has been unable to explain what these improvements were. The company must improve its understanding of the relationship between its maintenance performance, levels of service and spend.
2.43 We are concerned that without this understanding, National Highways will struggle to define what resource budget investment levels it requires to achieve a target level of service for RIS3 and beyond, or to provide evidence to support an understanding of the impacts of increasing or decreasing funding. A better understanding of the link between performance and spend should also make clearer to the company the line of sight with capital maintenance need and delivery. For example, where reactive maintenance performance improves as tired and defective assets are renewed.
Efficient delivery of the renewals programme
2.44 National Highways’ reporting of its capital renewals activity to date has focused on the renewals outputs it has delivered and the budget it has spent. This may show that work was delivered, but not whether it was the right work to address the right needs across the network at the right time.
2.45 In January 2020, to comply with its licence condition, National Highways published its asset management policy and strategy. An accompanying governance framework sets out the company's approach to asset management and defines its processes and procedures for asset-based decision making. In May 2022, it revised and published its asset management policy alongside an accompanying approach to asset management document.
2.46 To date, National Highways has been unable to provide us with sufficient confidence that what it is delivering through its maintenance and renewals programmes across all regions is evidentially linked to its asset management policy and governance. This limits our ability to assess whether the company's maintenance and renewals activity is appropriate given SRN asset need, and to what extent its delivery of planned works has successfully addressed that need. This is an important input to our assessment of efficiency for RIS2.
2.47 In 2020-21, we developed a reporting mechanism that allowed us to assess the extent to which the renewal schemes that National Highways delivered were those it had planned. We trialled this with the company in its East Midlands region to provide proof of concept so that it could be rolled-out to all regions in 2021-22.
2.48 National Highways identified a named list of the renewals schemes it planned to deliver. For that selection, the company reported at year-end on the following:
- the delivery progress it had made;
- the schemes that it planned to deliver, but had not delivered, with broad categories of reasons (for example, asset need or constrained budget);
- additional schemes that it had delivered, but moved from another year in RP2 (that is, still within the overall plan for RP2 delivery); and
- additional schemes that it had delivered, but had not identified as requiring delivery in RP2, with broad categories of reasons (for example, asset condition or need).
2.49 National Highways stated that the resource burden for rolling out this mechanism was too significant to repeat nationally. The company instead proposed to use a new computer-based tool, the Capital Delivery Management Tool (CDMT). The tool will not be available to use until September 2022. The company committed to provide to us an example of the relevant reporting that the CDMT will produce. However, at time of writing we have not received anything. We need to have early sight of the tool's reporting capabilities, ahead of full CDMT roll-out and reporting in September 2022. The company has told us that the reporting will demonstrate the extent to which its delivery meets its plans.
2.50 We also worked with National Highways over 2021-22 to establish what asset performance reporting the company has beyond the data provided against RIS2 performance specification metrics. For example, safety barriers feature as a major life extension renewals type in RIS2 and yet asset performance is not directly reported. The reporting should ultimately reinforce our understanding of the company's asset management capability. We want to be able to better assess the health of all its assets and to understand the impact of the maintenance and renewal works that the company delivers. To do this, we need to be able to see the company’s asset performance reporting across the full range of its assets. At the time of writing, we have not seen this reporting.
Design, build, finance and operate (DBFO) contract hand back
2.51 Contractors manage 11 routes across the SRN as private finance initiatives (DBFO contracts). Eight of the 11 DBFO contracts will come to an end in RP3. The contractors who currently operate the routes will hand them back to National Highways on the following dates:
- M1-A1 Link Lofthouse to Bramham – 25 March 2026
- A1(M) Alconbury to Peterborough – 31 March 2026
- A417/A419 Swindon to Gloucester – 31 March 2026
- A69 Carlisle to Newcastle – 31 March 2026
- A50 Stoke to Derby – 30 June 2026
- A30/A35 Exeter to Bere Regis – 30 September 2026
- M40 Denham to Warwick – 5 January 2027
- A19/A168 Dishforth to Tyne Tunnel – 23 February 2027
2.52 The DBFO contracts contain specific requirements for the hand back to National Highways. The company told us that it had made progress against those requirements. In 2021-22 it:
- continued to undertake initial inspections of assets and used lessons learned from those inspections to improve efficiency for the second round of inspections;
- developed proposals for, and commenced, required renewals to ensure that assets are handed back in the required condition;
- included DBFO routes in its revised depot strategies;
- included provision for DBFO routes in its ongoing winter maintenance vehicle fleet replacement programme;
- planned the transfer of data from DBFO contractors to National Highways;
- planned the demobilisation of DBFO contractors and mobilisation of relevant National Highways AD regions, including the transfer of staff; and
- started estimating the costs of future route operations.
2.53 Some aspects of performance that National Highways reports, such as asset condition, do not currently include the assets from DBFO routes. It is important that as part of a smooth transfer of responsibility, the company ensures that it has the capability to manage these additional assets.
2.54 The transfer should allow National Highways to better quantify its future asset funding needs within RIS3 and beyond. We will continue to examine how the company manages the transfer process in 2022-23.
3. Key message: environmental performance
National Highways' performance against its environmental targets is varied. In 2021-22 the company made good progress with its corporate carbon, noise, and air quality targets. However, we are concerned that it does not have a robust plan to achieve its target of no net loss in biodiversity by 2025. We require the company to provide evidence it is working quickly to rectify this and produce a robust plan.
3.1 In 2020-21, National Highways made good progress on its second road investment strategy (RIS2) commitments to reduce corporate carbon emissions by 75%, mitigate noise impacts on 7,500 households, and bring air quality on sections of its network into compliance with legal limits in the shortest possible time. The company will need to sustain its performance over the remainder of the second road period (RP2) to meet these targets.
3.2 However, we have challenged National Highways on its biodiversity delivery programme. We want to ensure that it is accurate, deliverable and will achieve the company's key performance indicator (KPI) target of no net loss in biodiversity by 2025. At the end of 2021-22, the company forecast a biodiversity net loss by 2025. Given this, and additional future impacts linked to enhancements funding and/or scheme schedule changes, we require National Highways to provide sufficient evidence that it is working quickly to rectify this position. We want to see a robust plan from the company by September 2022 setting out how it will achieve the KPI target by the end of RP2.
3.3 We will continue to scrutinise and challenge National Highways’ environmental plans and processes for delivering ongoing improvements and to meet the new requirements in the Environment Act 2021. We will report back on the company's progress in our 2022-23 annual assessment.
Outcome: being environmentally responsible Collapse accordion Open accordion
3.4 National Highways has four targeted KPIs, four performance indicators (PIs) and two commitments in this outcome area.
KPI: noise
3.5 National Highways has mitigated 3,178 households since the start of RP2. The company mitigated 1,067 households in 2021-22. The company has delivered 42% of its RP2 target. It is on track to meet the target given there are three years remaining in RP2, and it has a mature process of mitigating noise through installing double glazing and using lower noise road surfacing.
KPI: biodiversity
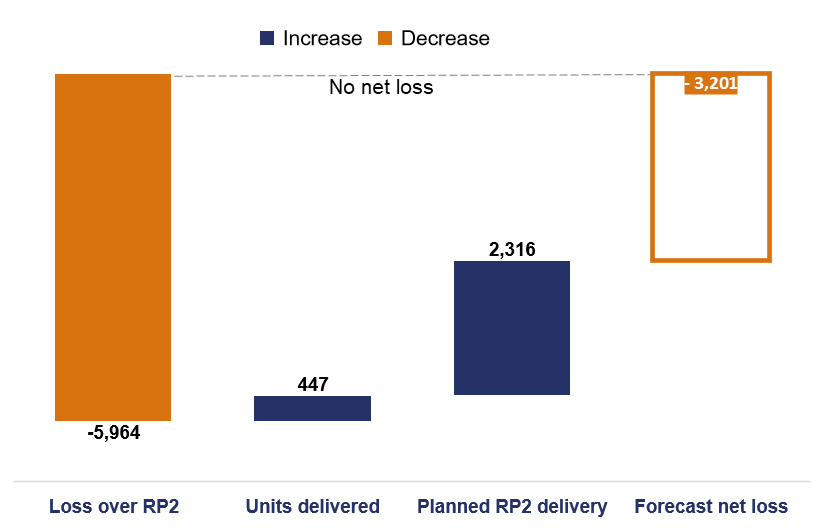
3.6 At the end of 2021-22, National Highways forecast a net loss of 3,201 biodiversity units for the end of RP2. We require the company to produce a robust a plan by September 2022 to deliver no net loss of biodiversity by 2025 and meet its KPI target.
3.7 A biodiversity unit is linked to the size, condition and location of a habitat or piece of land (see Natural England’s website). In 2020, National Highways calculated its biodiversity starting point of 130,848 units across its estate. This covers all the company’s land, including verges either side of the carriageway. The company then estimated the biodiversity loss from all enhancement schemes planned to start work in RP2, alongside a 1% degradation each year. This degradation accounts for loss from day-to-day renewals and maintenance activities and the operation of the network, such as noise and air pollution.
3.8 National Highways estimated what would happen if it carried out no additional biodiversity mitigation. Inclusive of the 1% degradation, there would be a loss of 5,964 biodiversity units over RP2.
3.9 We receive monthly biodiversity forecasts from National Highways that exclude schemes still in early design. As of March 2022, this forecast shows a net loss of 3,201 units by March 2025.
3.10 National Highways shared a biodiversity plan with us in January 2022 that includes schemes in early design. It estimated a net gain of 495 units. However, following delays to the largest single contributing scheme (Lower Thames Crossing), and a pause on the construction of new smart motorways following the Transport Select Committee recommendations, this plan would now produce a loss of 118 units by March 2025.
3.11 We require an updated plan from National Highways by September 2022, demonstrating how it plans to deliver no net loss by 2025. This plan must include what the company intends to do to improve biodiversity delivery and it must demonstrate that it has done everything reasonably practical to meet its KPI target.
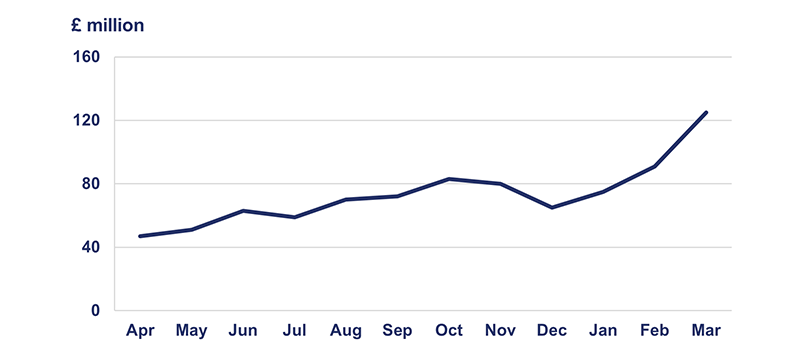
3.12 Figure 3.1 shows that in 2021-22, National Highways delivered 300 biodiversity units, with a total delivery of 447 units since 2020. This is far below the amount needed to account for even the 1% degradation each year.
Figure 3.1 National Highways’ biodiversity performance (excluding schemes in early design)
Case study: Biodiversity – Network for Nature
National Highways has a key performance indicator (KPI) target to achieve no net loss of biodiversity by 2025. To improve its biodiversity, the company is working in partnership with local wildlife trusts, managed by the Royal Society of Wildlife Trusts.
National Highways awarded £6m of its environment and wellbeing designated fund to the joint Network for Nature programme. The programme seeks to engage third party landowners to deliver habitat improvements on National Highways’ land, near to the strategic road network (SRN). The company undertook a feasibility study that estimated 1,579 biodiversity units would be gained from the programme. This would be a large contribution to National Highways’ KPI target. The programme will be refined as it progresses, and this will likely cause the value to change.
National Highways expects to deliver improvements that through the programme including:
- a new wetland close to the A49 to reduce pollution entering the River Lugg in Herefordshire, including a new sustainable drainage pool;
- restored chalkland alongside the M3 Junction 10 near Winchester to create larger areas of chalk grassland addressing the loss of habitat caused by construction of the M3 over 20 years ago; and
- new dormouse bridges alongside the M5 near Taunton to allow rare hazel dormice to travel across a wider area.
The Royal Society of Wildlife Trusts will evaluate the Network for Nature programme annually and each of the 26 projects within the programme. As part of its agreement with National Highways, the Trusts committed to produce a 30-year management plan for each project.
Improving habitats near to the roadside should allow pollinating insects, birds and small mammals to live, thrive and cross the SRN. This programme of work will help National Highways to meet its biodiversity no net loss KPI target. We will consider the annual programme-level evaluations to assess the impact the work has on the company’s delivery of its KPI.
KPI: air quality
3.13 We hold National Highways to account to deliver air quality mitigation on links identified by government. We work within a broader framework. Other bodies (Department for Transport (DfT), Department for the Environment, Food and Rural Affairs and the Joint Air Quality Unit) hold the company to account to improve air quality generally.
3.14 For air quality purposes, 'links' are stretches of road between junctions. There are 31 links on the SRN that exceed the legal limit for nitrogen dioxide, a pollutant common in vehicle exhausts. Figure 3.2 shows National Highways air quality performance at year-end 2021-22.
3.15 For 17 of the 31 links, National Highways has run through all potential measures to improve air quality, such as a bus retrofit, speed limits, traffic management measures or pollution barriers. DfT wrote to the company in September 2021 to accept that these links have no viable additional mitigation. The letter set out a monitoring regime National Highways must follow for each of these links. DfT also requires the company to publish an annual air quality report.
3.16 For the remaining 14 links, National Highways is designing and implementing air quality improvement measures, such as reduced speed limits, or working with local authorities to introduce localised electric van ‘try before you buy’ schemes for businesses. Eight links have air quality improvement measures in place. We are content with the progress that National Highways has made in delivering these measures.
Figure 3.2 National Highways' air quality performance at year-end 2021-22
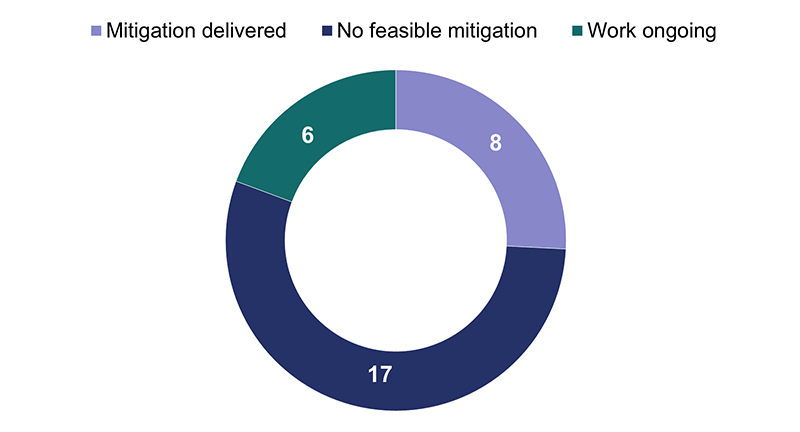
KPI: corporate carbon
3.17 In July 2021, National Highways published its Net Zero Highways plan. The plan set out three ambitions:
- net zero corporate carbon emissions by 2030;
- a net zero for maintenance and construction by 2040; and
- a net zero road network, including road users, by 2050.
3.18 National Highways has committed to reduce its corporate carbon emissions by 75% by 2025, and to achieve net zero corporate carbon emissions by 2030. The corporate carbon KPI captures most of the emissions mentioned in the plan. However, the company will have to include emissions from staff commuting, corporate procurement and motorway service areas in its corporate carbon KPI for the third road investment strategy.
3.19 National Highways emitted 37,178 tonnes of carbon dioxide (CO2) in 2021-22. This is higher than the company projected. However, it is a 59% reduction compared to its 2017-18 baseline.
3.20 The company’s performance in 2021-22 was affected by global supply chain issues, with two notable outcomes:
- slower than expected roll-out of LED lighting across the SRN due to a lack of funding; and
- slower delivery of new hybrid operational vehicles.
Figure 3.3 National Highways’ corporate carbon
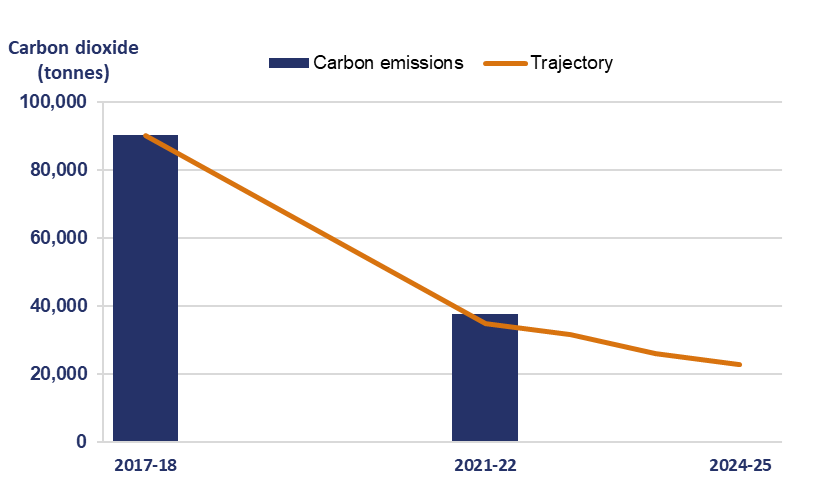
3.21 In April 2022, government approved a change to National Highways’ corporate carbon KPI. This was due to the company bringing most renewals and maintenance decisions into its direct control. The 75% target remained in place.
3.22 In the case study, we describe one of National Highways’ programmes to reduce corporate carbon emissions.
Case study: Corporate carbon green depots programme
National Highways has a target to reduce corporate carbon dioxide emissions from its estate and day-to-day operations to net zero by 2030. This is an ambitious target. The company must continue to invest in this area and maintain its focus to achieve net zero by 2030.
The largest contributor to the company’s corporate carbon emissions is the electricity used to light and power the strategic road network (SRN). Corporate carbon emissions also cover vehicle fuel for traffic officers’ vehicles, business travel, corporate purchases, and waste.
National Highways’ buildings represent 8% of its corporate carbon emissions, mostly through electricity use. This includes over 120 motorway maintenance compounds and depots that house the vehicles the company uses to operate and maintain the SRN. The company has invested to improve the energy performance of its buildings, including installing energy efficient LED lighting and smart lighting controls. The company estimates that these changes will lower the amount of electricity required to light the compounds and will minimise the associated carbon dioxide emissions.
Traffic officers in vehicles patrol the SRN and respond to incidents, driving over 12 million miles in 2021-22. National Highways has invested £5.3m in new plug-in hybrid and fully electric vehicles and has installed electric vehicle chargers across its sites and depots. This investment will help the company to transition its operational fleet to fully electric by 2030.
These measures will reduce the operating costs of maintaining the network alongside reducing National Highways’ corporate carbon emissions.
PIs: being environmentally responsible
3.23 PIs are untargeted metrics. They enable us to scrutinise more aspects of National Highways’ network performance beyond the headline KPIs.
Supply chain carbon emissions
3.24 National Highways’ supply chain is critical to the maintenance, renewal, and enhancement of the network. The supply chain emitted 286,238 tonnes of CO2 equivalent in 2021-22. This is lower than the 365,353 tonnes it emitted in 2020-21.
3.25 Supply chain emissions are affected by the amount of construction delivered on the network. To account for this, National Highways reports on the tonnes of CO2 equivalent per £1m spent with its supply chain. For 2020-21, the company reported 128 tonnes of CO2 equivalent per £1m spent. It will report on 2021-22 figures in 2022-23.
3.26 In its Net Zero Highways plan, National Highways committed to achieve net zero maintenance and construction emissions by 2040. The plan contained no actions for the company to deliver in 2021. In 2022, the plan contains four actions for the company to reduce maintenance and construction carbon.
Condition of cultural heritage assets
3.27 This PI measures the quality and condition of assets owned by National Highways that are listed on national asset registers, such as Historic England’s listed building data. National Highways reported an improvement in cultural heritage during 2021-22, with a cultural heritage score of 51,592. This is higher than the score of 51,580 that it reported in 2020-21.
3.28 This metric excludes assets owned by the Historic Railways Estate. This is managed by National Highways on behalf of DfT. We do not report on any aspect of the Historic Railways Estate. This is a matter for the department.
Water quality
3.29 National Highways improved 15km of watercourse in 2021-22, ahead of its own internal forecast of 3.5km. These improvements are funded by National Highways' environment and wellbeing designated fund.
Litter
3.30 In 2021-22, National Highways surveyed the SRN and reported that 60.8% of the network was rated at Grade A or B according to DEFRA’s litter code of practice. This was an improvement compared to 49.2% of the network in 2020-21.
3.31 National Highways told us that its performance was not higher because:
- local authorities are responsible for the collection of litter on A-roads; and
- safe litter collection on verges requires traffic management that can be disruptive to road users.
3.32 Where it did improve in 2021-22, the company told us this was due to increased sharing of best practice between regions, more detailed data to target litter collections and improved engagement with local highways authorities to clear litter on A-roads.
Commitments: being environmentally responsible
3.33 Commitments are priorities that are not suited to metrics, such as developing new metrics, publishing reports on specific performance items or improving reporting for future years.
Investigate, and as appropriate develop, new environmental metrics informed by the natural capital approach
3.34 The ‘natural capital’ approach is a way of measuring the value of the land in environmental terms, such as soil, water, air and living organisms. In September 2021 National Highways completed a feasibility study on a natural capital approach its environmental metrics. The study found no reliable way to weight different environmental themes within a single metric. Government agreed with the company that it should cease further development work on this commitment.
Investigate and assess incorporating into new and existing contracts air quality standards for supply chain vehicles deployed on National Highways work, and associated reporting requirements.
3.35 In 2021-22, National Highways developed a data capture plan for supply chain vehicle emissions. The company has told us it is continuing to work on developing a baseline in preparation to begin data collection.
4. Key message: enhancements
National Highways faced several challenges in 2021-22, but it met its in-year revised delivery commitments to start work on four schemes and open for traffic seven schemes. The company faces ongoing risks to delivery, such as planning issues, and needs to demonstrate that it is mitigating these. Otherwise, it will be challenging for it to deliver the remainder of its enhancements portfolio and other commitments on time and to budget, with the appropriate efficiency savings.
4.1 In our 2020-21 annual assessment, we reported on the delivery risks to National Highways’ RIS2 enhancements portfolio caused by planning issues (particularly Development Consent Orders, or DCOs) and the accompanying underspend for RP2.
4.2 Some aspects of these ongoing risks are not directly within National Highways’ control. However, it will need to mitigate them by engaging closely with stakeholders and the Planning Inspectorate to efficiently deliver the remainder of the second road investment strategy (RIS2) enhancements portfolio and its other commitments on time and to budget.
4.3 In the first quarter of 2022-23, the Secretary of State approved four DCOs, three of which had progressed through the six-week period during which the decision may be legally challenged.
4.4 We will continue to hold National Highways to account for its enhancements delivery, ensuring that it appropriately manages planning-related delivery risks across the remainder of the second road period (RP2).
RIS2 enhancements portfolio overview Collapse accordion Open accordion
4.5 During the first two years of RP2, National Highways faced significant risks. The company made changes to its enhancements portfolio to mitigate these risks. In this chapter we:
- give an overview of the key challenges impacting the delivery of RIS2;
- set out the significance of the changes the company made at portfolio level across the first two years of RP2, the increased risks to delivery, and the impact on financial performance and efficiency; and
- review the company’s 2021-22 performance achieving its start of work (SOW) and open for traffic (OFT) commitments.
4.6 National Highways’ original commitments (2020-2025 delivery plan) were to achieve SOW on 43 schemes and OFT 52 schemes. By the end of 2021-22, government had agreed to change these commitments to achieve SOW on 32 schemes and OFT 38 schemes.
4.7 Across the first two years of RP2, National Highways achieved:
- SOW on nine schemes out of the 15 schemes it had originally scheduled to start; and
- OFT on ten schemes out of the 11 schemes it had originally planned to open.
The company must achieve SOW on 23 further schemes and OFT 28 schemes across the remainder of RP2. Figures 4.1 and 4.2 show the impact of these changes on the original commitments.
Figure 4.1 Revisions to original SOW commitments at year-end 2021-22
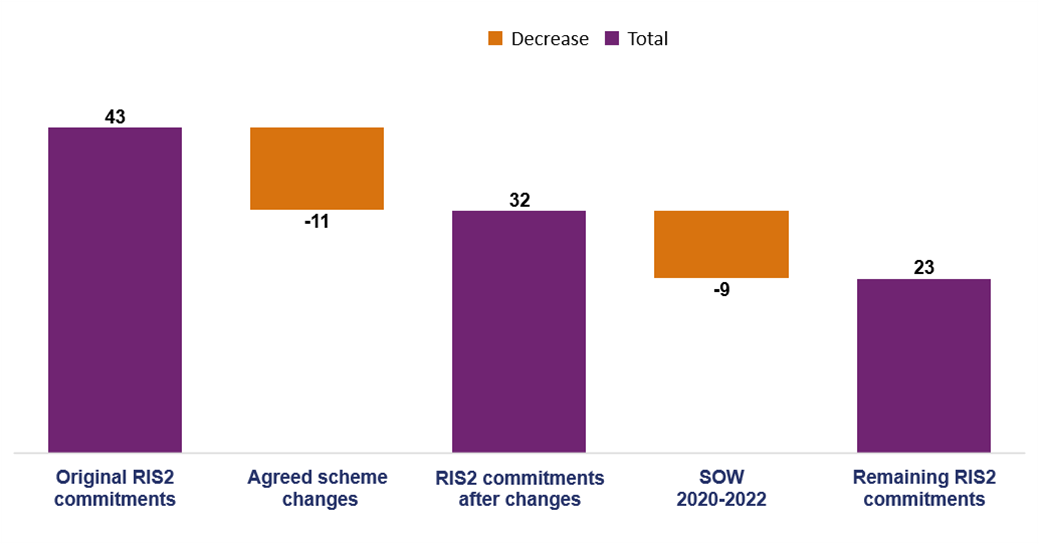
Figure 4.2 Revisions to OFT commitments at year-end 2021-22
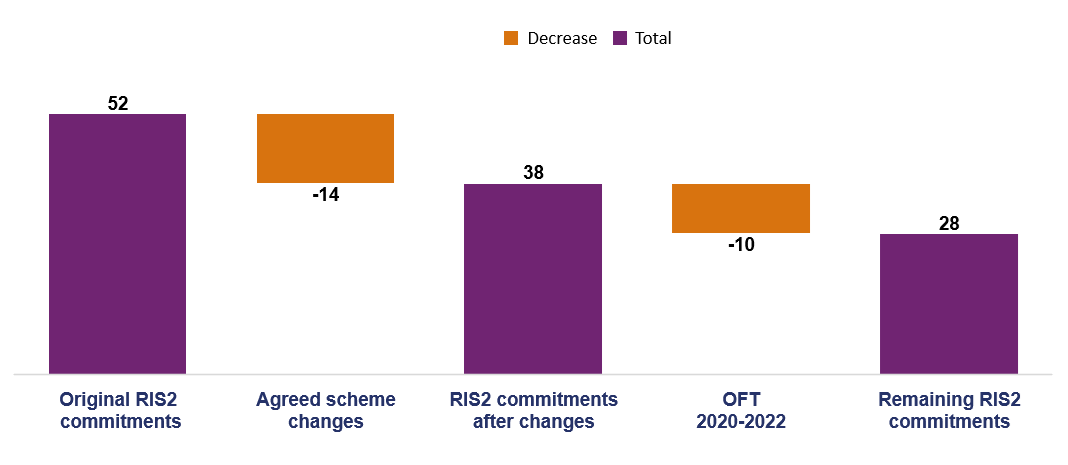
4.8 The changes described in figures 4.1 and 4.2 were mainly driven by planning delays and in part by the Transport Select Committee (TSC) recommendations on the roll-out and safety of smart motorways. This means there will be less construction in RP2 and more in the third road period (RP3). The planning delays caused a large forecast underspend in RP2. This was addressed through a reduction in capital funding in Spending Review 2021 (SR21). These changes are discussed in paragraph 4.38.
Key challenges for RP2 delivery
4.9 Our key message reflects the fact that the development and delivery of RIS2 enhancements schemes faced several challenges. This has affected National Highways' ability to achieve its enhancements commitments. The challenges include:
- planning consents, including DCOs;
- government response to the TSC recommendations; and
- additional challenges impacting delivery.
4.10 We set out below how each of these challenges has affected the company's ability to deliver its enhancements programme.
Planning consents, including DCOs
4.11 National Highways requires DCOs for its large and significant enhancement schemes, classified as Nationally Significant Infrastructure Projects (NSIPs). The Planning Act 2008 introduced a new development consent process for NSIPs. The Planning Inspectorate considers applications and makes recommendations to the Secretary of State, who then decides whether to grant consent for a proposed scheme.
4.12 In RIS2, National Highways has a total of 33 schemes that require DCOs. In our 2020-21 assessment, we emphasised the risk that delayed DCO planning consents posed to National Highways' SOW commitments for its large and significant enhancement schemes (chapter 4). That risk persisted into 2021-22 and remains.
4.13 In early 2021, National Highways identified that planning delays had caused slippage to five scheme schedules. Four were a result of DCO delays and one due to a public inquiry for a planning application under the Highways Act 1980. This was due in part to a greater focus on climate change and environmental protection and ensuring that planning applications properly took account of legal duties and government policy.
4.14 National Highways responded to our concerns relating to its development of DCO applications by working with DfT to identify and mitigate risks in the DCO process. In 2021-22 the company improved the quality and detail of the information it provides to us. This includes programmed DCO applications, and approval dates. We will continue to assess how the company mitigates its risks. Annex tables B.4 and B.5 list pending DCO schemes.
4.15 National Highways planned to submit seven DCO applications during 2021-22. By year-end 2021-22 it had submitted six applications, three of which had previously been delayed. The application for Lower Thames Crossing remains outstanding.
4.16 Figure 4.3 shows the status of DCO applications and decisions at the end of June 2022. Annex tables B.3 to B.5 provide more detail on each scheme.
Figure 4.3 Status of RP2 DCOs at June 2022
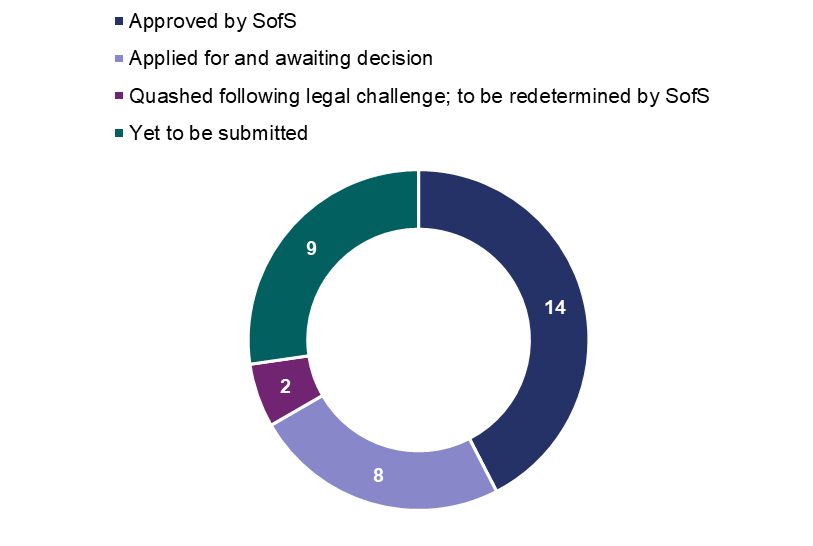
Government response to the TSC recommendations
4.17 In January 2022 government announced it would pause the roll-out of 11 all lane running (ALR) smart motorway schemes yet to start work until five years’ safety data has been collected (chapter 1). Of the 11, two schemes achieved SOW before the pause was announced. Some safety aspects of these schemes are going ahead but without conversion to ALR. If the safety data National Highways collects proves inconclusive, this could cause uncertainty about the future of these schemes.
4.18 National Highways has also agreed with DfT to create additional emergency areas on existing smart motorways and to install stopped vehicle detection as per the action in the smart motorway action plan. This delayed the original OFT committed dates for four schemes scheduled in 2021-22.
4.19 Taken together, these changes to the smart motorways programme will have knock-on effects for road users across the remainder of RP2 and into RP3. Annex table B.6 shows the projects in the smart motorways programme and the relevant changes to them following the announcement of the pause.
Additional challenges impacting delivery
4.20 The enhancements portfolio Value for Money (VfM) assessment remained relatively steady over 2021-22 with 27% of the portfolio reporting a high VfM assessment. There are nine schemes identified as having a low or poor VfM rating, with one scheme cancelled in July 2021 due to its poor VfM assessment (A5 Dodwells to Longshoot). National Highways will undertake further analytical assurance of these schemes as they progress through the development and options stages. We will assess the impact of low or poor VfM status on portfolio commitments during 2022-23.
4.21 During 2021-22, we advised DfT that two of National Highways’ committed schemes in its delivery plan should be classified as missed commitments. The reasons the company gave for missing its commitments were:
● A428 Black Cat to Caxton Gibbet: early contractor involvement identified impractical design assumptions that could not be mitigated; and
● A417 Air Balloon: the company undertook additional consultation with several stakeholders. This resulted in significant design changes.
National Highways should have foreseen these issues and mitigated them beforehand.
Changes to the RIS2 portfolio
4.22 The original RIS2 (RIS2 2020) listed 43 schemes committed to achieve SOW during RP2. During the first two years of RP2, government agreed to change the RIS2 2020 commitments to 32 schemes (figure 4.4). Annex B provides further details about the schemes and sets out SOW commitments by region.
Figure 4.4 Government agreed changes for SOW commitments
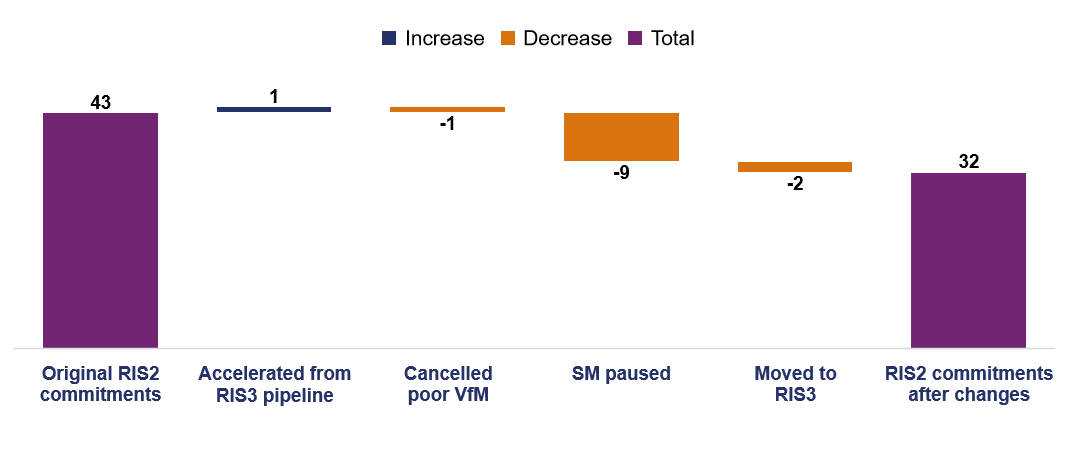
4.23 RIS2 2020 listed 52 schemes committed to OFT. During the first two years of RP2, government agreed to change the RIS2 2020 commitments to 38 schemes (figure 4.5). Annex B provides further details about the schemes and sets out OFT commitments by region.
Figure 4.5 Government agreed changes for OFT commitments
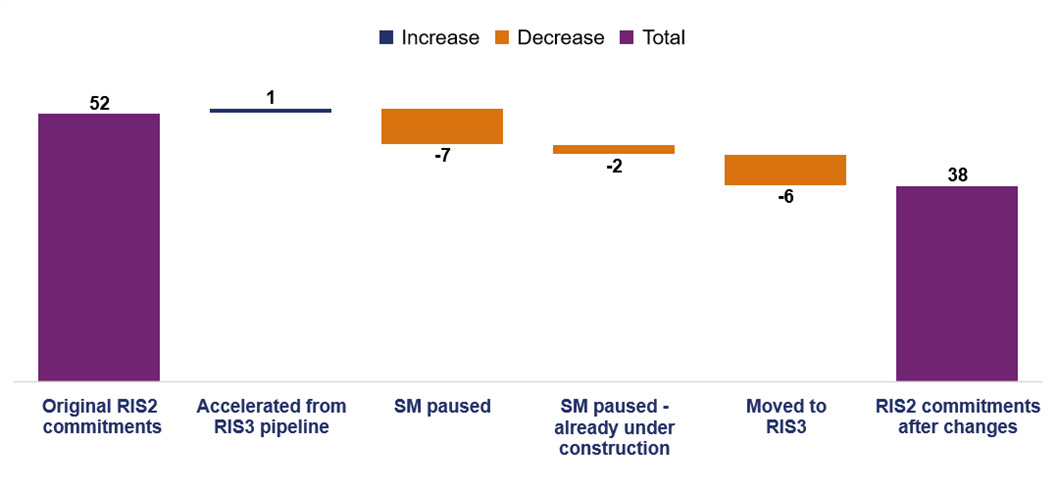
4.24 Taken together, the key challenges to RP2 delivery set out in paragraph 4.9 led to 32 enhancements scheme changes to RIS2 2020 commitments. Government agreed five changes in 2020-21 and 27 changes in 2021-22. Figure 4.6 shows the different reasons for these changes.
Figure 4.6 Agreed changes to enhancements schemes by reason
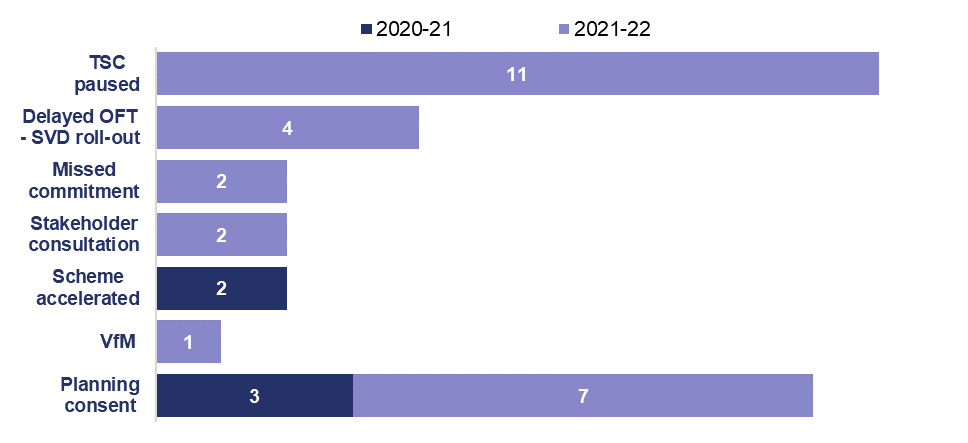
4.25 These challenges and the subsequent volume of agreed changes are indicative of ongoing risks to National Highways not achieving its RIS2 commitments. Across the first two years of RP2, the number of schemes reporting a risk to a SOW or OFT commitment increased substantially.
4.26 Figure 4.7 shows the significant change to risk profiles between 2020-21 and 2021-22. National Highways has told us it has plans in place to address these risks. In the figure, 11 paused smart motorway schemes (see paragraph 4.17) are included in the ‘on track’ category but are not currently reported to be at risk. Annex tables B.10 to B.15 list individual schemes.
Figure 4.7 RIS2 enhancements scheme commitments status
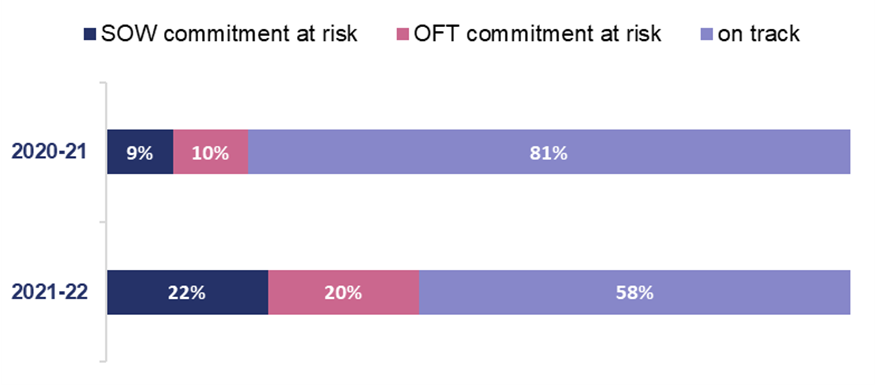
4.27 We are concerned that the risks National Highways faces in 2022-23 and beyond will exacerbate the trend we have seen over the past two years and lead to an increased number of schemes at risk. This could ultimately impact the delivery of RIS2 KPIs. The company must demonstrate that it has robust risk mitigations in place to minimise slippage to its programme. We will hold the company to account for the delivery of its commitments.
2021-22 enhancements delivery performance Collapse accordion Open accordion
4.28 Since the start of RP2, National Highways has progressed schemes through its project lifecycle stages. It has continued to develop and deliver a steady volume of schemes and has not focussed only on construction activities. Figure 4.8 shows the progress of enhancement schemes from the start of RP2 to year-end 2021-22.
Figure 4.8 The progress of enhancement schemes during 2021-22, comparing the start of RP2 with year-end 2021-22
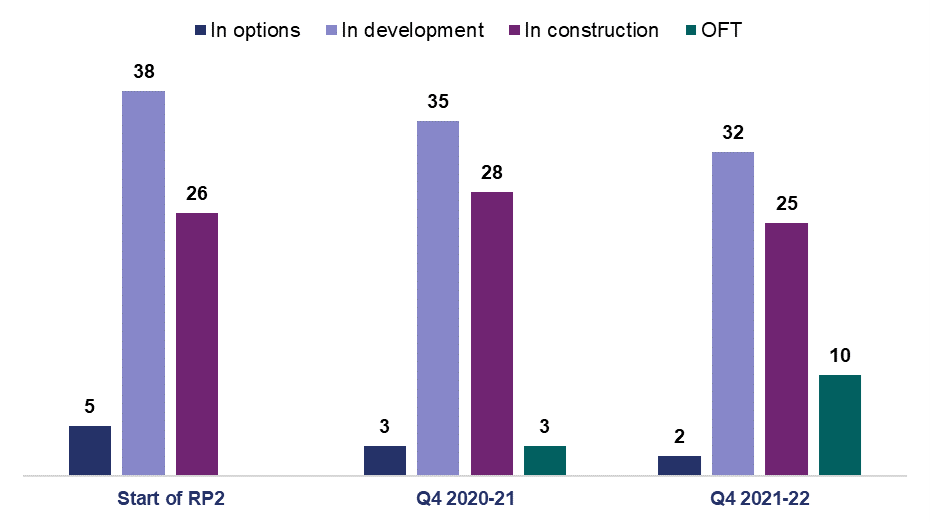
4.29 In 2021-22, National Highways progressed schemes through its RIS2 commitment milestones:
- four schemes from development to SOW (see paragraph 4.30); and
- seven schemes from construction to OFT (see paragraph 4.31).
RIS2 SOW commitments delivery performance
4.30 National Highways’ 2020-25 delivery plan committed the company to achieve SOW on nine schemes in 2021-22. As a result of the changes set out in figure 4.9, the company committed to achieve SOW on 11 schemes. By year-end 2021-22, the company’s SOW commitment was reduced to four schemes. It achieved SOW on the four schemes.
Figure 4.9 Revised SOW commitments for 2021-22
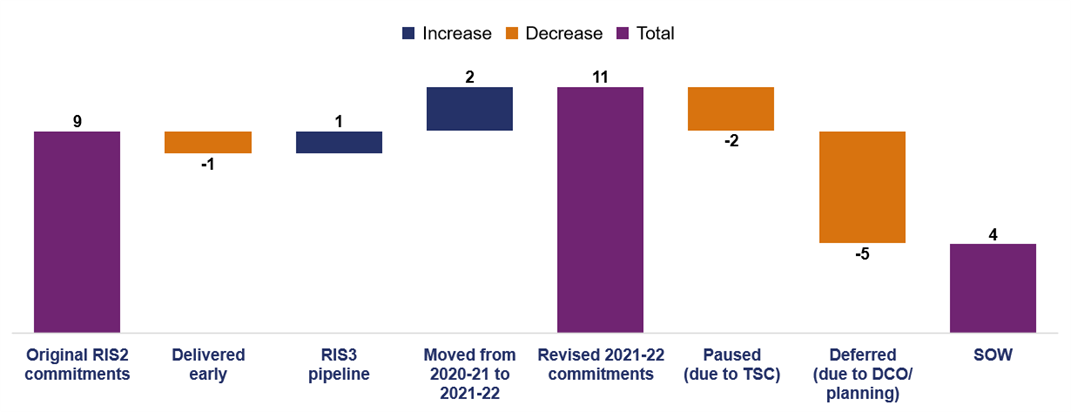
RIS2 OFT commitments delivery performance
4.31 National Highways’ 2020-25 delivery plan committed the company to OFT nine schemes in 2021-22. As a result of the changes set out in figure 4.10, the company committed to OFT four schemes in 2021-22.
4.32 National Highways’ 2021-22 delivery plan update had a revised commitment to OFT seven schemes. Figure 4.10 shows that by year-end 2021-22, the company had reported seven schemes OFT.
Figure 4.10 Revised OFT commitments for 2021-22
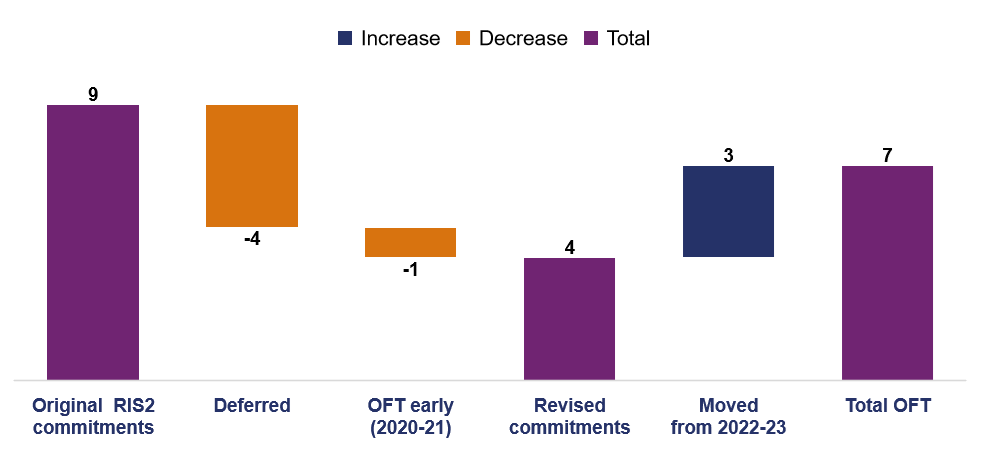
Enhancements delivery for the remainder of RP2 Collapse accordion Open accordion
4.33 National Highways has worked to mitigate its risks, but it still faces significant challenges both within and outside its control, for example, achieving timely DCO approvals. Failure to successfully mitigate its risks will likely result in the company starting work on more schemes later in RP2 or deferring works into RP3. This could put pressure on road space, leading to negative knock-on impacts for road users across the whole road network.
4.34 Government agreed changes to the enhancements delivery programme with National Highways. This produced a flatter profile of works, with peak activity in 2022-23. Figure 4.11 shows the number of schemes in construction during RP2.
Figure 4.11 Number of schemes in construction in each year of RP2
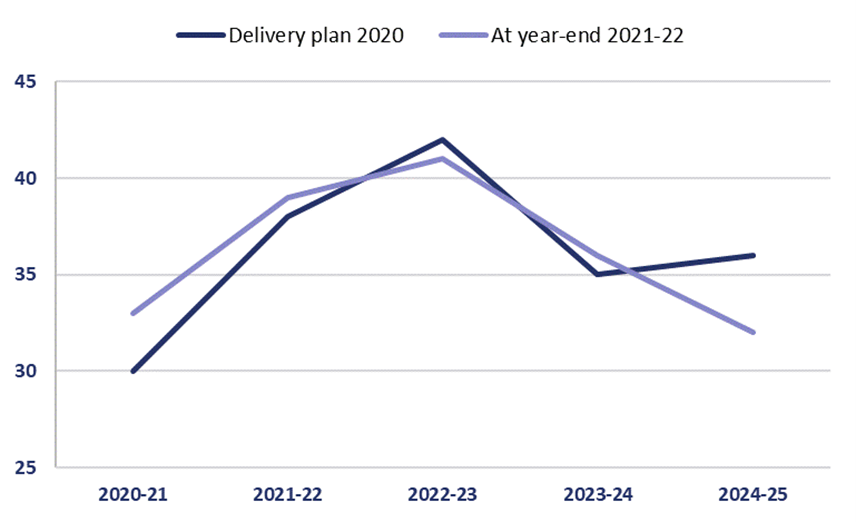
4.35 National Highways plans to use RIS2 funding to develop 32 pipeline schemes for RIS3. The company has committed to advance these pipeline schemes during RP2 by at least one full stage of its project control framework (PCF) process. By the end of 2021-22 the company was on track to achieve this. Figure 4.12 shows the current stages of development of the pipeline schemes. We will continue to hold the company to account to ensure that it progresses schemes in the RIS3 pipeline in line with its plan.
Figure 4.12 Stage of development of pipeline schemes
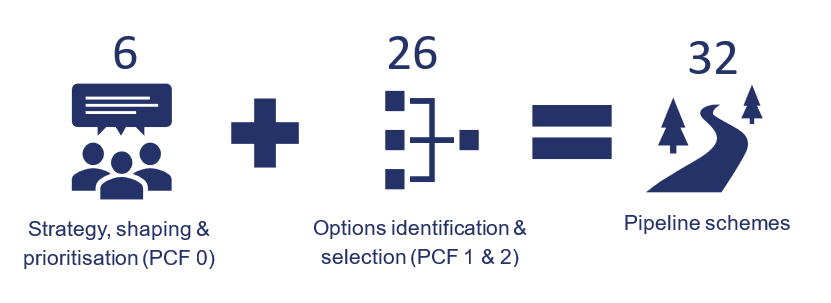
4.36 In our 2020-21 annual assessment, we reported on the challenges National Highways faced in terms of its capability and capacity to plan and deliver RIS2, as highlighted in a review we published alongside the assessment. The company has made good progress against the review’s recommendations, and it is planning further work for 2022-23. Annex paragraphs B.28 to B.30, set out in more detail how the company responded to the review. The following case study shows the company’s progress against a key recommendation of the review.
Case study: Knowledge bank – lessons learned
In March 2021 we published an enhancements capacity and capability review of National Highways, undertaken with the company. One of the report’s key recommendations was for the company to put clear and easy-to-follow procedures in place from which it could learn lessons from previous schemes and apply that learning to future schemes. In response, by the end of summer 2021 National Highways had established an online knowledge bank.
The website is accessible to all National Highways and supply chain staff, working in integrated project teams. One of the intended benefits of the website is to link lessons learned to project governance and assurance frameworks.
National Highways started developing case studies to share on the website. Between June 2021 and March 2022, the company added to the website 171 case studies covering 13 topics. These included studies from the following enhancements schemes:
- A19 Norton to Wynyard: safeguarding the natural environment;
- A63 Castle Street: managing archaeological risk; and
- A14 Cambridge to Huntingdon: utilities asset record quality improvement.
National Highways is working towards identifying and closing any knowledge content gaps on the website. The company is also developing and delivering knowledge sharing events that bring together people across its business to learn from each other’s experiences. It plans to publish outputs on the website. The company must now show what tangible benefits have been achieved through sharing case studies in the knowledge bank.
RIS2 enhancements financial performance Collapse accordion Open accordion
4.37 In our 2020-21 annual assessment, we reported that National Highways’ £551m RP2 forecast underspend did not reflect all scheme slippage risk.
4.38 In 2021-22, the company identified £3,753m of RP2 ‘headroom’ (forecast underspend, risk of further underspend and other scheme changes) affecting enhancements. Government removed £3,528m of (mainly capital) funding in SR21 and gave National Highways an additional efficiency challenge by removing £110m. It retained £335m for new commitments and other unfunded RIS2 activity. Overall, the company’s RP2 funding for enhancements reduced from £14,108m to £10,534m (total RIS2 funding was reduced to £24,009m).
4.39 Post-SR21, government approved changes to commitments for 12 schemes. Figure 4.13 shows how scheme construction periods moved back in RP2 and further into RP3 as a result of the changes.
Figure 4.13 Construction periods at the start of RP2 and at Q4 2021-22 for 12 schemes where RIS2 funding was reduced in SR21
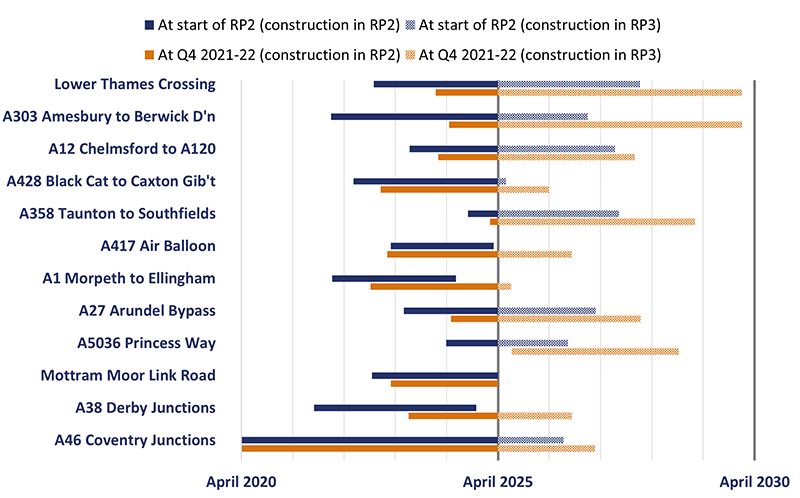
4.40 National Highways reduced its forecast spend on enhancements in RP2 and increased its forecast spend for RP3 because of these changes. RP2 forecast expenditure is now £2,663m (20%) below the level at the start of RP2. The company's forecast expenditure on RIS2 enhancements during RP3 and beyond has increased by £4,069m (64%) since the start of RP2. Figure 4.14 shows that National Highways expects expenditure on RIS2 enhancements to be broadly equal in RP2 and RP3 and beyond.
4.41 The increase in RP3 and beyond expenditure on the ‘RIS2 tail’ (schemes committed within the RIS2 portfolio) may limit government’s choices for new investment in RIS3. The level of funding the government provides for RIS3 outputs will not be agreed until 2024-25.
Figure 4.14 Change in enhancements forecast costs for RP2 and RP3 and beyond (£ million)
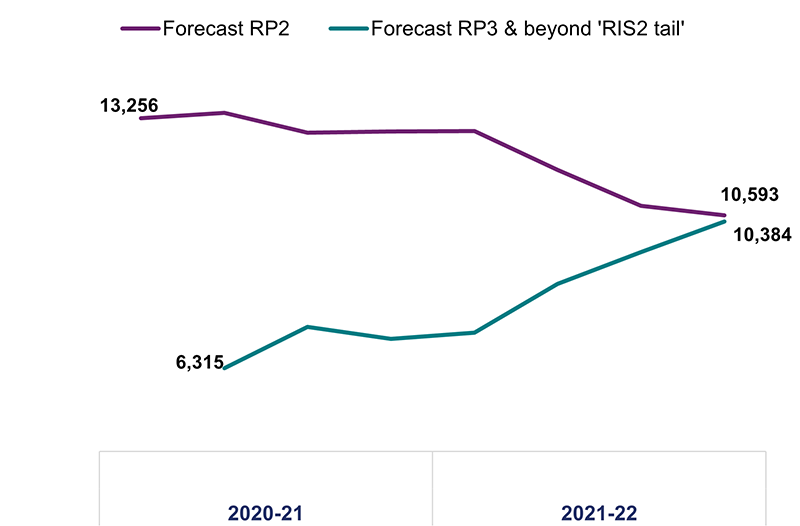
4.42 Overall, following these changes to baseline and forecast in 2021-22, National Highways is forecasting an overspend of £237m in RP2. This is due to £86m of forecast overspend on enhancements schemes and £151m on other enhancements costs, including legacy costs of previously completed projects.
4.43 Since SR21, National Highways has continued to report an underspend within its in-year budget due to enhancements slippage. In 2021-22, the company reported an underspend of £631m against its budget. However, £556m of the 2021-22 funding was removed as part of SR21, leaving a £75m surplus. Government agreed to move this funding to later years when it will be required. Early forecasts for 2022-23 indicate a much larger underspend, driven in part by scheme slippage, and it is not yet clear if all the underspend can be moved. We are also concerned that in-year underspends requiring funding to be moved to later years could be a leading indicator of schemes continuing to slip. This risks the company missing commitments and/or losing funding from RP2.
4.44 Scheme delays, other cost pressures and the acceleration of the A66 Northern Trans-Pennine scheme have increased the total outturn cost of enhancements schemes by £911m (4%) since the start of RP2. Annex paragraph A.36 provides details of what is included in the enhancements expenditure category. The change varies by programme:
- Complex Infrastructure Programme (CIP) projects increased by 11%;
- Regional Investment Programme (RIP) projects increased by 6%; and
- Smart Motorways Programme (SMP) projects reduced by 19%.
4.45 Figure 4.15 reflects both the impact of scheme delay on forecasts for CIP and RIP projects and the pause in the roll-out of smart motorway schemes announced in January 2022 (see paragraph 4.17). The Lower Thames Crossing scheme, the largest in the RIS2 portfolio, contributed £1,009m (17%) to the overall increase.
Figure 4.15 Change in major schemes total outturn since the start of RP2 (£ million)
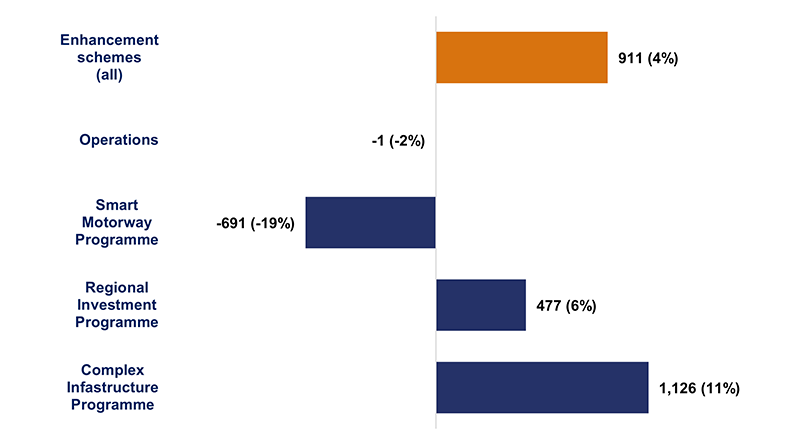
Enhancements use of Central Risk Reserve (CRR)
4.46 National Highways has a CRR held separately within its capital funding to manage portfolio-level risks and other risks not accommodated within its core budgets. Annex figure A.13 shows that the company made substantial provision from the CRR for enhancement schemes in the first two years of RP2. With three years remaining in RP2, there is currently £294m left in the CRR, including £130m for enhancements.
4.47 We have raised a concern with National Highways that the enhancements balance remaining in the CRR may be insufficient for the remainder of RP2. The company recognises our concern, particularly around the risk of continuing and/or increasing high inflation. However, the company has told us that many schemes are now at a more mature stage of development (25 of 69 schemes are still in options or development) compared to the start of RP2 (43 in options or development).
4.48 National Highways told us it has already managed or planned for mitigation of associated risks on a high proportion of schemes. Also, schemes in construction have incentives built into the contracts to manage risks, for example to share financial risk between the company and its contractors.
4.49 It is important to note that whilst scheme delays have reduced RP2 forecast expenditure, this does not reduce pressure on the CRR because it was also reduced. Scheme slippage may lead to an increased CRR requirement on the remaining expenditure. This is because a delayed project would be exposed to higher inflation on construction costs in years when it would otherwise have already been OFT.
4.50 During 2021-22, we commissioned a review of how National Highways had used its CRR and the implications for how we scrutinise and the company reports its efficiency. This identified areas for development in RP2 on governance, forecasting and external reporting. In addition, it also identified changes that the company could introduce for RIS3 to provide greater clarity over its use of the CRR. The report is published alongside this assessment.
4.51 We will continue to scrutinise National Highways’ use of the CRR and work with the company to ensure that it appropriately and effectively implements improvements to its management of the CRR during RP2 and RP3.
Efficiency impact of RP2 enhancements changes
4.52 The significant changes to the enhancements portfolio in 2021-22 (paragraphs 4.30 to 4.32) also impacted National Highways' ability to achieve its efficiency target for RP2. To account for the changes, government agreed to a reduction in the company's efficiency KPI target from £2,230m to £2,111m.
4.53 Despite this reduction in the company's overall efficiency target, the enhancements portfolio changes mean that the company expects to deliver a larger share of total RIS2 efficiency savings in the final years of RP2. This adds to the inherent risk of a back-end-loaded efficiency delivery plan. The company's efficiency performance in the first two years of RP2 was broadly in line with its plans, although the quality of evidence needs further improvement (see chapter 6).
4.54 However, we consider that there is an increasing risk of National Highways under-delivering efficiency on its enhancement schemes in RP2 because of the portfolio changes, risks to enhancements delivery and the level of CRR remaining in 2021-22. The company recognised the challenges it continues to face in its 2021-22 Efficiency Report (to be published in July 2022). We are concerned that it has not reported a forecast of performance against its efficiency KPI based on its view of the impact of these risks. The company states that this is due to the level of uncertainty in its assumptions at this stage of RP2.
5. Delivering for road users
5.1 The strategic road network (SRN) serves a broad range of users, vehicles and journey types. Those who use the SRN, whether in a car, van, lorry, bus or coach, or on a motorcycle or bicycle, on foot or on horseback – as well as those who live and work alongside it – have an expectation that it should meet their needs. Consequently, assessing how the SRN delivers for its users relies on a range of information, indicators and measures.
5.2 This chapter describes how National Highways is performing against key performance indicators (KPIs) and performance indicators (PIs) that measure performance across two outcome areas: delivering for road users, and fast and reliable journeys.
5.3 In June 2021, government suspended National Highways’ KPI target for measuring road user satisfaction due to the impact of the coronavirus (COVID-19) pandemic on data collection. Consequently, we have supplemented this data with additional quantitative and qualitative information, and a review of how National Highways delivered its customer service plan in 2021-22.
5.4 For fast and reliable journeys, traffic levels in 2021-22 were higher than in 2020-21. This led to increased delays and reduced journey time reliability compared to last year. However, the company still performed better compared to pre-pandemic figures.
5.5 In combination, the range of information, indicators and measures form a picture of National Highways’ performance. Overall, user satisfaction has remained high, although we have been cautious about drawing firm conclusions from the data. The company has delivered most of its customer service plan commitments and there is evidence that it is endeavouring to meet a broader range of users’ needs. However, there is still more to do, particularly with regards to the needs of the logistics and supply chain sector.
Outcome: meeting the needs of all users Collapse accordion Open accordion
5.6 National Highways has two targeted KPIs in this outcome area, three PIs and six commitments.
5.7 Government suspended the company’s road user satisfaction target for 2021-22. However, a variety of quantitative and qualitative measures collectively indicate that the company made steady progress in 2021-22 to improve user satisfaction. The company achieved this in the context of a changing operational environment due to the COVID-19 pandemic and the post-pandemic recovery.
KPI: road user satisfaction
5.8 The Strategic Roads User Survey (SRUS) measures road user satisfaction, and the achievement of the associated target. Transport Focus employs a specialist survey company to gather SRUS data. The survey measures six aspects of user satisfaction, in addition to overall satisfaction. The respondent is asked to rate their satisfaction with their last journey made on the SRN, in the previous 28 days. The sample is designed to be representative of all users and their travel behaviour across the SRN.
5.9 Before the COVID-19 pandemic, SRUS data was collected using face-to face-interviews. In March 2020, in response to safety concerns resulting from the pandemic, Transport Focus suspended data collection. Consequently, in April 2021, Transport Focus introduced a ‘push-to-web’ methodology, where respondents use an online questionnaire.
5.10 However, there are risks in comparing data between months and years for the following reasons:
- traffic and travel patterns in 2021-22 were influenced by the different COVID-19 pandemic restrictions;
- response rates were lower for the online compared to the face-to-face survey, the sample was smaller, and some amendments were made to fine-tune the online survey; and
- most significantly, the move from a face-to-face to an online data collection methodology may have affected how SRN users responded. For example, there appears to be a trend towards more neutral answers from respondents using online SRUS.
5.11 Because of these risks, in June 2021 government suspended National Highways’ user satisfaction KPI for 2021-22. This is the second year in a row that the company has not had a user satisfaction KPI target.
5.12 In the absence of the KPI target, we have again taken a more qualitative approach to assessing the company’s performance in this area. This approach uses the following sources of information:
- SRUS;
- HighView – National Highways’ own survey of its customers’ experiences (road user satisfaction);
- evidence from National Highways setting out how it delivered the outputs of its 2021-22 customer service plan;
- evidence from Transport Focus’ in-depth studies, for example, the Logistics and Coach Managers Survey; and
- findings from our own study of National Highways’ engagement with the communities that the SRN passes through (to be published alongside this assessment).
5.13 Figure 5.1 shows the monthly average ratings of those surveyed using SRUS.
Figure 5.1 SRUS road user satisfaction in 2021-22 (%)
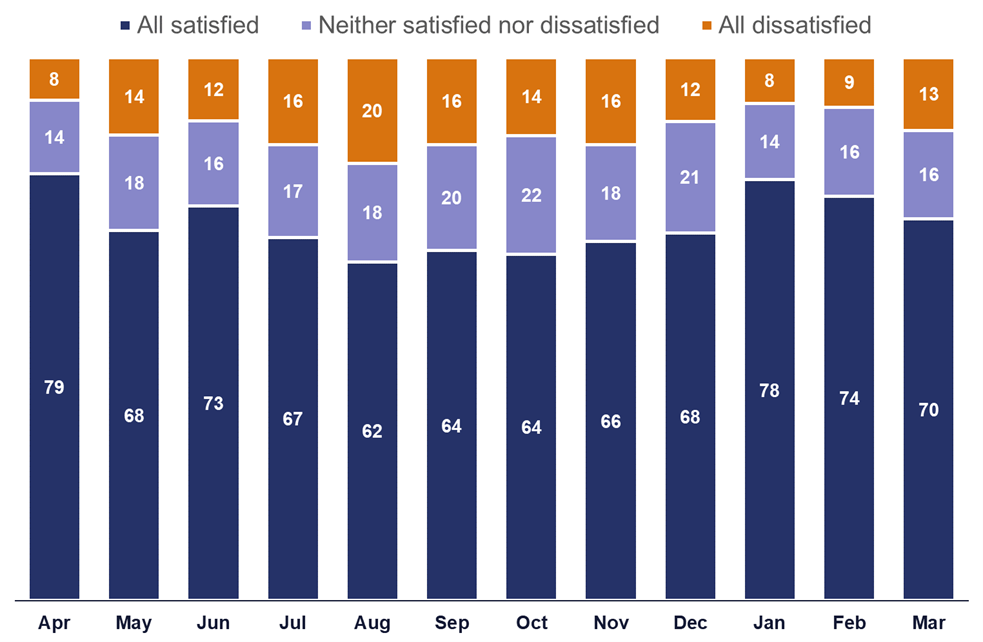
5.14 HighView is National Highways’ monthly online customer experience survey. It is made up of around 21,000 responses per year split equally across each of the company’s regions. It provides insight on SRN users’ journey experiences in the four weeks prior to being surveyed.
Figure 5.2 HighView ‘fairly good’ and ‘very good’ customer experience in 2021-22
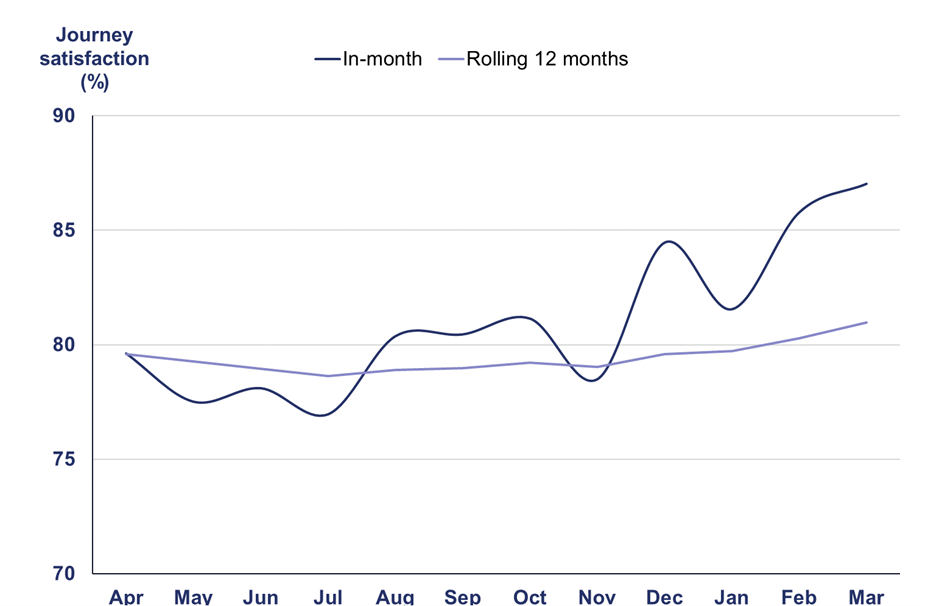
5.15 We have used HighView customer experience data this year (as we did in 2020-21) as a temporary measure to understand user satisfaction using trend analysis. The 12-month rolling average percentage of respondents who rated their journey on the SRN as ‘fairly good' or ‘very good’ was consistently around 80%, with a slight variation of between one and two percentage points. The in-month ratings were predominantly on an upward trend across the year, and results in Q4 2021-22 were particularly high.
5.16 SRUS and HighView are not directly comparable and have different methodologies and purposes. However, when the trends in the two data sets are reviewed alongside each other there is evidence to suggest that National Highways maintained overall journey experience for road users over 2021-22.
5.17 In May 2021, National Highways published its annual customer service plan. This is part of its broader customer service strategy. We met regularly with the company to review its delivery of the outputs. Of the 51 initiatives contained in the 2021-22 plan, it removed five and delivered 44 of the remaining 46 initiatives.
5.18 Some of the initiatives delivered by the company in 2021-22 were:
- 114 access guides for motorway service areas to give disabled people information about facilities;
- open access data for satnav providers on the precise locations of emergency areas on all lane running motorways;
- a travel demand management plan to mitigate the impact of its concrete roads programme in the East region; and
- further roll-out of its customer feedback tool.
5.19 The two initiatives that the company did not deliver, and their outcomes in 2021-22, were:
- Initiative: Use the insight from customer audits performed on major road projects to make improvements, to achieve an overall, monthly rolling average, audit score of at least 90%.
Outcome: The company missed this target by one percentage point. Although the monthly score steadily increased from 87% in March 2021 to 92% in March 2022, the rolling average score fell short of the target; and - Initiative: Improve response to customer correspondence to respond within 10 days; on average (12-month rolling) between 83 – 86% and in-month (for March 22) 90% of the time.
Outcome: The company failed to achieve one part of this two-part target. The company’s 12-month rolling score was 82.7%, and therefore this target was not met. The second part of the target was met as the in-month score for March 2022 was 90%.
5.20 In 2021-22, we commissioned consultants to review National Highways’ engagement with non-users in communities adjacent to the SRN. The report (to be published alongside this assessment) concluded that overall, the company’s processes for engaging with non-users were largely sound, but there was scope for small improvements.
5.21 Government has suspended the SRUS target for 2022-23. Reintroduction of the target will require a longer time series of data to give confidence that survey responses are stable and comparable. In addition, we will continue to assess other sources of data to measure user satisfaction once the SRUS target is reintroduced.
KPI: roadworks information timeliness and accuracy
5.22 In 2021-22, National Highways accurately notified 68.1% of roadworks involving an overnight closure within seven days. This was an improvement on year-end 2020-21, when 54.5% of roadworks were notified. At the start of RP2 (April 2020), the company’s accuracy rate was 41.6%. The company’s end of RP2 KPI target is 90.0%. Figure 5.3 shows the company’s performance in more detail.
5.23 National Highways’ reported that performance against this KPI varies across its regions, further regional detail is available in our 2021 Benchmarking National Highways progress update. The company has told us it is sharing best practice between regions and updating its processes. The company’s biggest reported contributor to poor performance is where notified road closures do not go ahead due to bad weather. This affects monthly performance more during winter and the company needs to better account for seasonal weather in its planning.
5.24 We have seen year-on-year improvements, and National Highways is ahead of a straight-line trajectory towards its KPI target. However, we will need to see continued effort from the company to maintain this level of improvement and meet its end of RP2 KPI target. Furthermore, as it matures as a network operator and has full control of its maintenance and renewals activities, we expect to see the company improve its planning of roadworks and closures.
Figure 5.3 National Highways’ accuracy and timeliness of roadworks
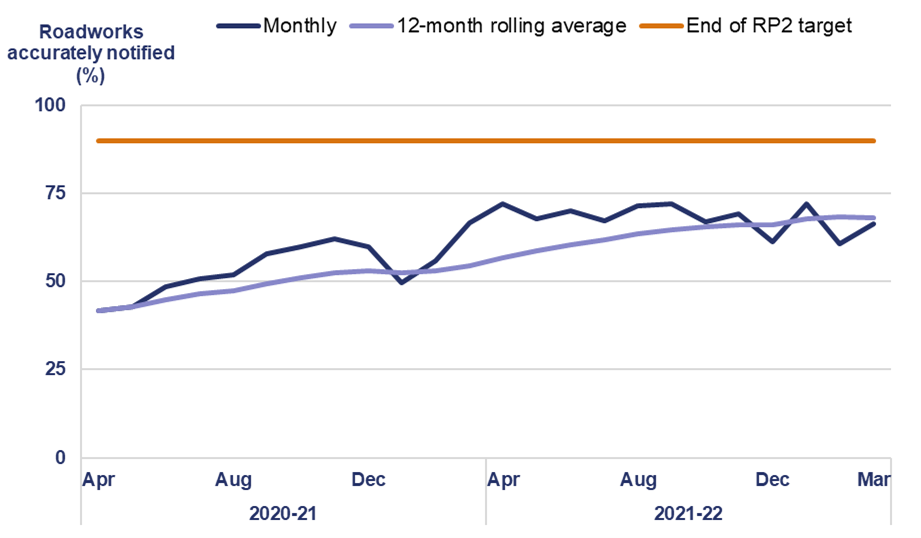
PIs: meeting the needs of all users
5.25 PIs are untargeted metrics. They enable us to scrutinise more aspects of National Highways’ network performance beyond the headline KPIs.
Timeliness of information to road users through electronic signage
5.26 In 2021-22, National Highways took an average (median) time of 2m 11s to set signs and signals on motorways after being notified of an incident. This was slower than the 2020-21 average of 1m 53s.
Ride quality
5.27 The ride quality metric was designed to better represent car drivers’ experience of using the road, separate to the pavement condition KPI (see chapter 2). It is based on the smoothness of the road surface for each 10-metre length of road. In 2021-22, National Highways achieved ride quality satisfaction of 98.4%, a decline of 0.1 percentage points compared to 2020-21. A new ride quality metric will go live by the end of 2022.
Working with local highway authorities to review diversion routes for unplanned events
5.28 In 2021-22, National Highways engaged with 97.2% of local highway authorities in England to review diversion routes for unplanned events. This was a 44.2 percentage point increase on 2020-21.
Commitments: meeting the needs of all users
5.29 Commitments are priorities that are not suited to metrics, such as developing new metrics, publishing reports on specific performance items or improving reporting for future years.
Review SRUS performance in 2021-22 to determine targets later in RP2
5.30 As explained in paragraph 5.11, government agreed to pause this commitment until the new SRUS methodology has matured, and Transport Focus has collected a suitable time series of data to determine appropriate targets.
Develop a measure of ride quality that reflects road users’ experience
5.31 This commitment is to develop a measure of ride quality that reflects road users’ experience of the network. This would expand on the current PI on ride quality, based on road condition. On October 2021, government approved a six-month delay to account for the impact of the COVID-19 pandemic on road user testing. Government and the company have agreed that the new ride quality PI will go live by the end of 2022.
Case study: Meeting the needs of the logistics sector
We recognise the importance of the logistics sector and its essential role serving the UK economy. The lorries and vans travelling along the strategic road network (SRN) form part of a critical and complex supply chain network serving communities and businesses across the country. In turn, the SRN is important to the functioning of supply chain businesses and its performance has significant commercial consequences.
It is important that National Highways considers the needs of the logistics sector, makes commitments that support these needs and delivers on them.
Transport Focus undertakes the Logistics and Coach Managers’ survey. The survey provides a useful insight into the issues and challenges the logistics sector faces when using the SRN.
The 2021-22 survey highlighted three areas of particular concern. National Highways started work to deal with some of these issues in 2021-22:
- availability, value for money and quality of lorry parking provision: the company commissioned a study to identify potential improvements for freight vehicles. This included a proposal to create new lorry parks by converting contractor compounds on new road schemes after completion, or on sections of redundant highway;
- suitability of diversion routes after incidents: the company updated its customer service standards for planned diversion routes (GG907 of the Design Manual for Roads and Bridges). It trialled new ways of working so that routes are more suitable for lorries, including being clearly signed, providing visibility for higher driving positions, and giving access to alternative rest stops; and
- National Highways’ understanding of the sector’s business needs: the company commissioned Ipsos to create an online Professional Driver Community to learn directly from professional drivers who frequently travel on the SRN. It started in January 2022 and will run for the remainder of RIS2.
National Highways has committed to develop a plan to address the issues raised in the survey. We will hold the company to account for the development and delivery of the commitments in its plan.
Investigate expanding the scope of the timeliness of electronic signage information PI
5.32 National Highways started work on this commitment in April 2020. In May 2022, government agreed that the company could cease work as initial data showed that the time to clear signs was the same as the time taken to set signs, an existing PI.
Develop a satisfaction survey for cyclists and pedestrians
5.33 National Highways discussed this commitment with Transport Focus and agreed to develop a qualitative survey. They jointly commissioned work with a view to conducting a pilot survey in 2022-23.
Develop satisfaction surveys for logistics and coach managers
5.34 National Highways and Transport Focus developed a logistics and coach manager survey. The survey was launched in 2020 and it is carried out three times a year. Transport Focus published the latest survey results in May 2022.
5.35 Since April 2020 the company has been working with Transport Focus to redesign this survey. This was due to be completed by the end of June 2022. National Highways has committed to develop a plan to address any issues.
Investigate expanding the scope of the working with local highway authorities PI
5.36 Government has ceased the development of this metric. There is a statutory requirement on National Highways to work with local authorities on planned diversion routes. This meant that the proposed PI reported 100% each month.
Outcome: fast and reliable journeys Collapse accordion Open accordion
5.37 National Highways has three KPIs, five PIs and three commitments in this outcome area.
Traffic levels
5.38 Traffic levels on the SRN rose year-on-year until the first COVID-19 pandemic lockdown in March 2020. In 2020-21 traffic levels fell to a low of 26% compared to 2019-20 and absolute numbers were close to levels not seen since 1993. Congestion is the largest contributor to delay on the road network. With more vehicles on the road in 2021-22, average delay rose substantially (see paragraph 5.40).
5.39 Traffic returned to 94% of pre-pandemic levels in March 2022, growing from 68% in March 2021. Freight vehicle traffic is above pre-pandemic levels. At present, many delay metrics for the SRN continue to report good performance levels because of the lower traffic levels in 2021-22.
KPI: average delay
5.40 The average delay on the SRN in 2021-22 was 8.8 seconds per vehicle mile. This was higher than the 6.7 seconds per vehicle mile average delay in 2020-21, but still below the amount of delay in March 2019 to February 2020 of 9.5 seconds per vehicle mile. The baseline month was moved from March 2020 to February 2020 to remove the impact of the COVID-19 pandemic on traffic levels and delay. Figure 5.4 shows National Highways’ average delay performance.
Figure 5.4 National Highways’ average delay (seconds per mile) performance
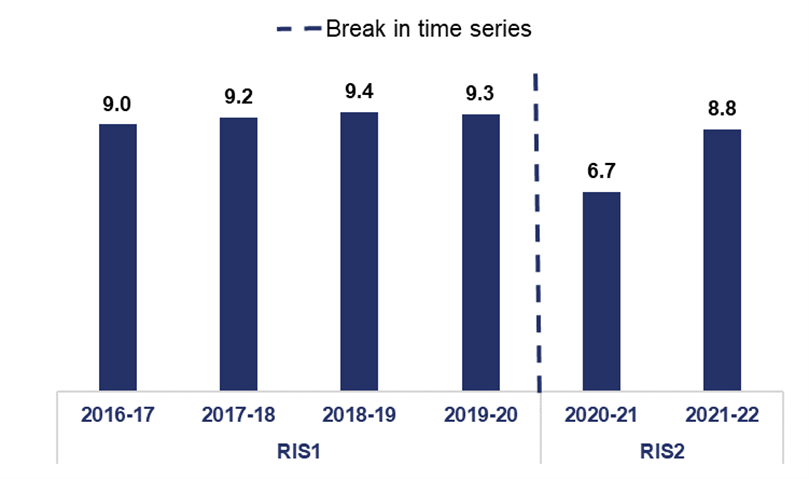
KPI: roadworks network impact
5.41 This KPI measures the impact of roadworks on road users. It combines:
- the length of roadworks;
- the amount of time they are in place on the network;
- the number of lanes affected; and
- the type of traffic management in use.
In 2021-22, roadworks network impact averaged 42.7 million against National Highways’ target to keep below 43 million. This was a significant increase compared to 39.8 million in 2020-21. The impact on KPI performance was due to more enhancement schemes in construction in 2021-22 on the SRN that increased the total length of roadworks.
KPI: incident clearance rate
5.42 In 2021-22, National Highways cleared 87.1% of incidents affecting traffic flow on its motorways within one hour. This is above the RP2 target of 86% but lower than in 2020-21, when it cleared 88.6% of incidents within one hour. The company told us that the increase in traffic following the easing of COVID-19 restrictions resulted in a higher volume of incidents, with a knock-on effect on clearance speeds. Figure 5.5 shows the company’s incident clearance performance.
Figure 5.5 National Highways’ incident clearance performance
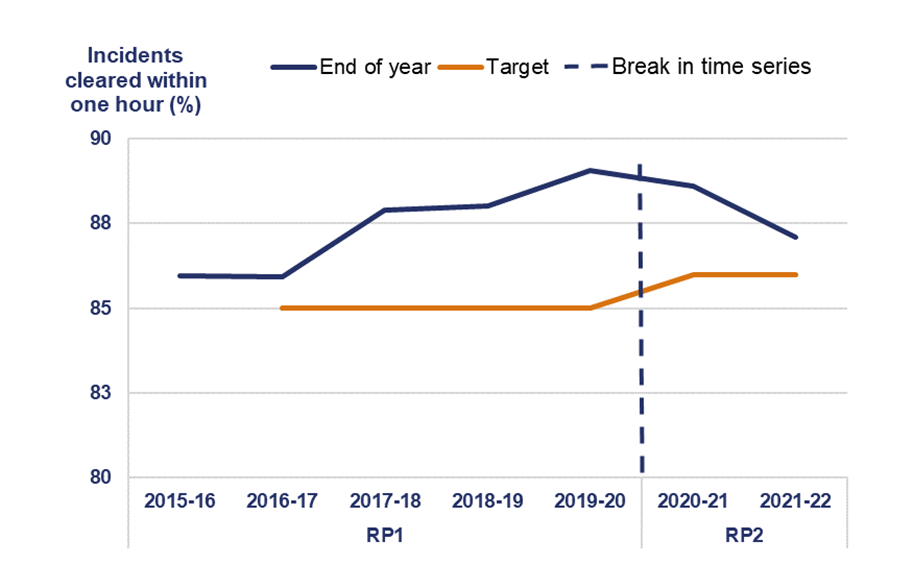
PIs: fast and reliable journeys
5.43 PIs are untargeted metrics. They enable us to scrutinise more aspects of National Highways’ network performance beyond the headline KPIs.
5.44 For each of the PIs below, the difference in performance in 2021-22 compared to 2020-21 can largely be explained by the higher traffic flows on the SRN in 2021-22.
Average delay on smart motorways
5.45 This PI compares the actual journey time on smart motorways compared to travel time based on the set speed limit at the time. In 2021-22, average delay on smart motorways was 9.9 seconds per vehicle mile. This was higher than 2020-21, when delay was 5.8 seconds. This is a new metric for RP2, so a comparison to pre-pandemic delay is not possible.
Average delay from roadworks
5.46 This PI measures the additional delay caused by roadworks. In 2021-22, roadworks added an average 1.20 minutes of delay to journeys per hour travelled. This was higher than in 2020-21, when it was 0.94 minutes per hour travelled. A contributing factor may have been more enhancements schemes in construction on the SRN in 2021-22.
Journey time reliability
5.47 This PI measures the difference between actual travel times and the expected travel time including regular congestion. This would include unplanned incidents and additional congestion over and above normal amounts. In 2021-22, reliability was 2.8 seconds per vehicle mile. This was higher than in 2020-21, when it was 1.9 seconds per vehicle mile.
Average delay on gateway routes
5.48 This metric looks at the average delay experienced by road users on the roads serving airports and ports across England. It is designed to measure the impact of delay on freight. In 2021-22, delay on these roads was 7.9 seconds per vehicle mile. This was higher than in 2020-21, when delay was 5.6 seconds per vehicle mile.
Average speed
5.49 The average speed of vehicles travelling on the SRN was 58.6 miles per hour in 2021-22. This was slower than in 2020-21, when average speed was 60.7 miles per hour.
Commitments: fast and reliable journeys
5.50 Commitments are priorities that are not suited to metrics, such as developing new metrics, publishing reports on specific performance items or improving reporting for future years.
Replace existing network availability KPI with a new expanded metric
5.51 National Highways has completed this commitment. It has been reporting the new KPI since April 2021.
Investigate the development of new metrics on journey time reliability and delay in roadworks
5.52 In 2021-22 National Highways worked with Transport Focus and consultants to identify new metrics that would make its reporting more accessible to road users. The company has told us that by December 2022 it will deliver new metrics to measure journey time reliability and the effects of delays from roadworks.
Investigate new PIs on delays from incidents and delays on the SRN/local road boundary and an alternative performance measure for smart motorways operations
5.53 National Highways completed design and started development of an incident delay metric in February 2022, with development due to be completed by September 2022.
5.54 The company undertook feasibility studies into delay on the SRN/local road boundary between April and December 2020.The study concluded that such a metric would be technically complex, as large amounts of data would be required and the metric would not provide any actionable intelligence. In May 2022, government agreed to cease development of the boundary delay metric.
5.55 The company investigated an indicator related to smart motorway journey time reliability. It began development in October 2021 and is due to complete by September 2022. This is linked to the new journey time reliability PI commitment (see paragraph 5.52).
Designated funds Collapse accordion Open accordion
5.56 National Highways has four designated funds, assigned a total of £936m across RP2. The purpose of these funds is to address issues that are of particular importance to road users and stakeholders, beyond the traditional focus of roads investment. The funds are:
- environment and wellbeing;
- users and communities;
- safety and congestion; and
- innovation and modernisation.
5.57 Government agreed to reprofile the allocated amounts of each designated fund following SR21. This reduced the budget for 2021-22 designated funds from £197m to £150m. Government allocated £47m for the remainder of RP2.
5.58 National Highways spent £123m across its funds in 2021-22, against a revised budget of £150m. This was an underspend of £27m. The company reported that whilst it approved £160m of projects in the year, it underspent due to individual project delays. Table 5.1 shows the breakdown by individual fund. The five largest delayed projects account for 70% of the underspend in 2021-22. These were:
- Greater Manchester clean air zone signage (environmental and wellbeing fund);
- A30 cycling scheme (users and communities fund);
- M42 legacy scheme (users and communities fund);
- M181 Lincolnshire Lakes (growth and housing RP1 fund); and
- A46 RAF Newton (growth and housing RP1 fund).
Table 5.1 Designated funds budget and spend in 2021-22
| Fund (RP2 total) | 2021-22 revised budget | 2021-22 spend | Annual budget (%) |
|---|---|---|---|
| Environment and wellbeing (£410m) | £60m | £53m | 89 |
| Users and communities (£167m) | £32m | £29m | 90 |
| Safety and congestion (£145m) | £32m | £19m | 59 |
| Innovation and modernisation (£214m) | £26m | £23m | 87 |
| Total (£936m) | £150m | £123m | 82 |
5.59 National Highways also reports three milestones for each designated fund project:
- feasibility;
- detailed design; and
- implementation.
5.60 Table 5.2 shows that in 2021-22 National Highways did not progress designated funds projects through the three milestones as it had planned.
Table 5.2 Designated fund project milestones in 2021-22
| Fund | Milestones planned | Milestones completed |
|---|---|---|
| Environment and wellbeing | 50 | 32 |
| Users and communities | 60 | 22 |
| Safety and congestion | 110 | 50 |
| Innovation and modernisation | 30 | 16 |
| Total | 250 | 120 |
5.61 The company reports that it delivered against its milestones in 2021-22 but it has not internally validated this. The company will need to validate the progress of these projects in 2022-23. We require National Highways to take steps to comply with its validation process in a timely way so that we have confidence that the company is effectively delivering designated fund projects.
5.62 National Highways has moved its £27m total 2021-22 underspend into future years of RP2, alongside the £47m previously moved following SR21. This higher level of spend in the final years of RP2 is a risk to delivery. The company needs to spend more in 2022-23 than it has done in any other single year in RP2.
5.63 In 2021-22 National Highways approved in advance £112m of funding for 2022-23, against a total budget of £165m. The company is over-programming the funds in 2022-23 to ensure that it uses its total budget. The exact amount it spends will depend on whether and how it delivers its planned projects.
5.64 We will hold National Highways to account for its progress in delivering its designated fund projects across the remainder of RP2.
6. Efficiency performance
6.1 We hold National Highways to account for its delivery of its efficiency key performance indicator (KPI). This includes reviewing the efficiency evidence that the company reports.
6.2 National Highways has an efficiency KPI, set out in the second road investment strategy (RIS2). It originally required the company to deliver £2,304m of efficiency in RP2. In 2020-21, government agreed to revise the KPI to £2,230m. This was due to changes made to smart motorway specification to deliver the requirements of the smart motorway action plan. The changes included conversion of dynamic hard shoulder schemes to all lane running and further roll-out of stopped vehicle detection.
6.3 During 2021-22, government agreed to revise the KPI further to £2,111m. This was because of two changes to RIS2 made during the year:
- The funding reduction from Spending Review 2021 (SR21) was mainly due to delays in schemes achieving planning approval and subsequent formal change to scheme schedules. This change also included an additional efficiency challenge, applied in-line with a government-wide efficiency programme; and
- changes to enhancements following government’s acceptance of the Transport Select Committee’s (TSC) recommendation to pause the roll-out of new smart motorway schemes.
Figure 6.1 shows the impacts of these changes to the efficiency KPI.
Figure 6.1 Change in KPI target from start of RP2 (£ million)
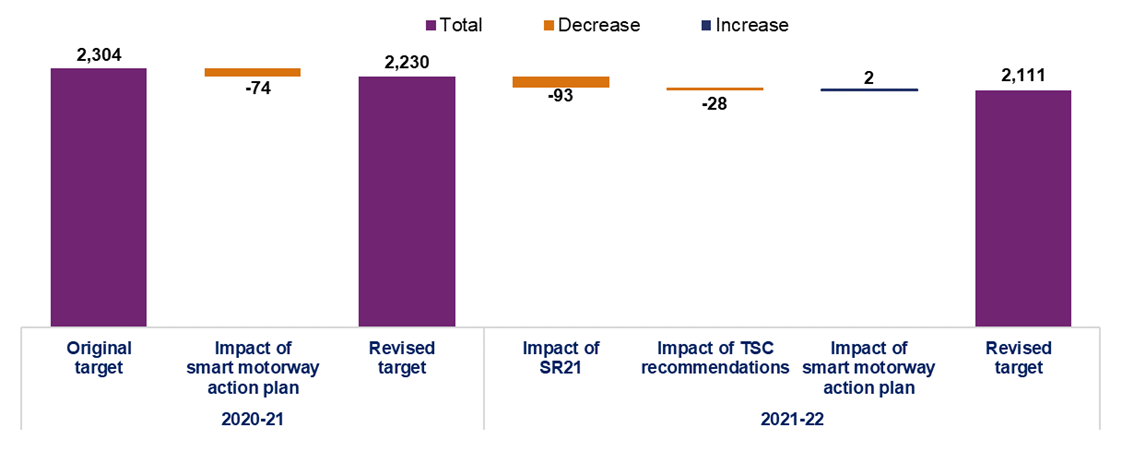
National Highways’ reported efficiency across the first two years of RP2 Collapse accordion Open accordion
6.4 National Highways sets internal cumulative milestones to track its progress towards achieving its efficiency KPI target by the end of RP2. We support the company’s progress by assessing and reporting on the quality of the evidence it presents during the road period and for its final reported position in March 2025. The internal cumulative milestone it set for 2021-22 was £471m. This value is unadjusted for the changes to the KPI.
6.5 As set out in figure 6.2, National Highways reported a cumulative efficiency total of £502m. This was 24% of the efficiency KPI target and £31m more than the company’s internal 2021-22 milestone. Paragraphs 6.8 to 6.29 set out our assessment of the evidence the company presented.
Figure 6.2 Cumulative reported efficiency against RIS2 KPI (£ million)
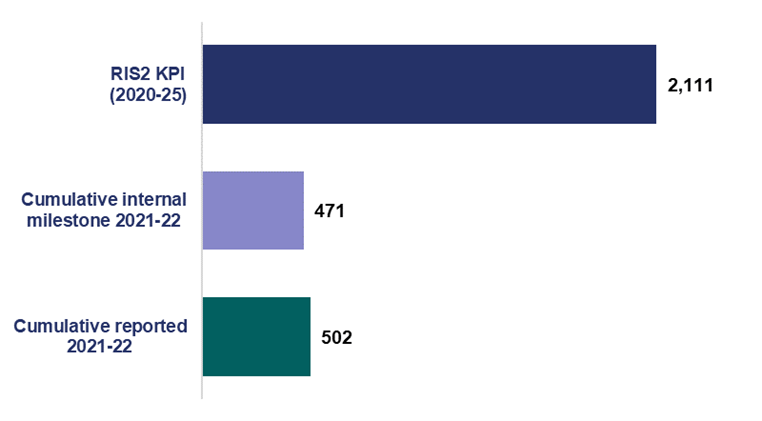
6.6 As set out in figure 6.3, National Highways has reported £502m of cumulative efficiency against its internal milestone of £471m. This is made up of:
- £243m related to embedded efficiency where efficiency is ‘baked-in’ to RIS2 through reduced funding;
- £68m related to measured RP2 generated efficiency that does not reduce funding but reduces risk in RP2 or in the third road period (RP3) and beyond; and
- £191m related to carry-over efficiency, representing the RP2 element of the first road period (RP1) delivered efficiency.
Figure 6.3 Cumulative reported efficiency (£ million) 2021-22 by type
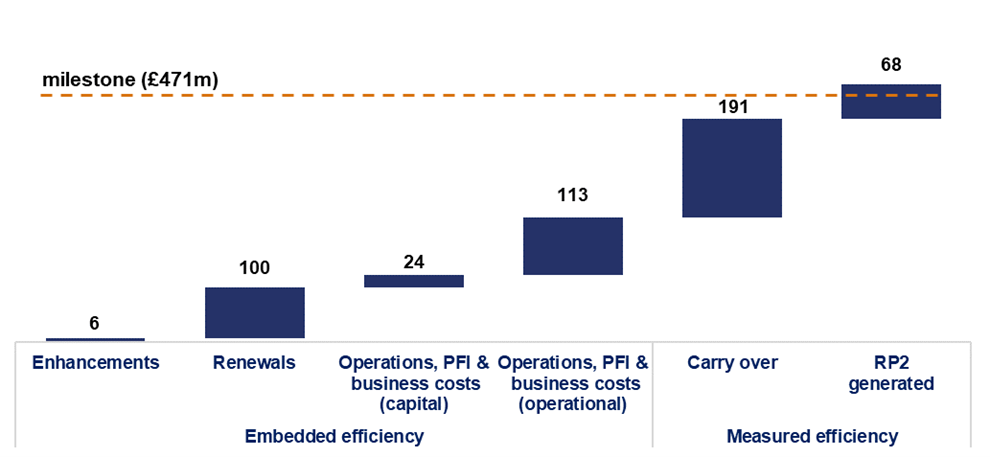
6.7 Figure 6.4 shows the different types of efficiency and the supporting primary and secondary evidence the company presents to support the reported values. National Highways’ Efficiency Report, published annually, provides definitions of types of efficiency and summarises the evidence for its reported efficiency.
Figure 6.4 Sources of evidence for different types of efficiency by expenditure category
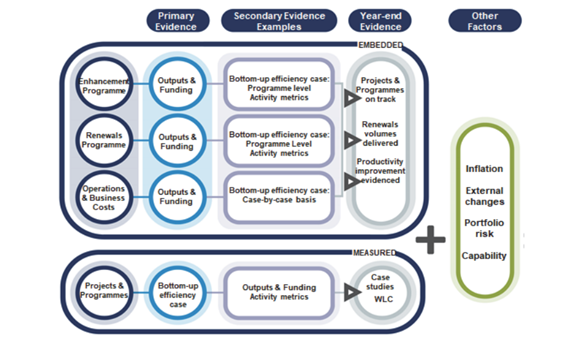
Source: National Highways’ Efficiency and Inflation Monitoring Manual
Assessment of cumulative efficiency evidence 2021-22 Collapse accordion Open accordion
6.8 Tables 6.1 and 6.2 show our assessment of the quality of National Highways’ evidence to support its reported efficiency in the years 2020-21 and 2021-22. The colours indicate a summary of our view of the evidence quality. Where we indicate there is developing evidence, we believe it requires improvement.
Table 6.1 Embedded efficiency reported and our assessment of supporting evidence
| Expenditure categories | Reported cumulative (£243m) | Primary: outputs and funding | Secondary: activity metrics | Secondary: case studies |
|---|---|---|---|---|
| Capital enhancements | 6 | Developing evidence | Developing evidence | Developing evidence |
| Capital renewals | 100 | Developing evidence | Developing evidence | Good evidence |
| Operations and business costs (capital expenditure) | 24 | Developing evidence | Not available | Developing evidence |
| Operations and business costs (operational expenditure) | 113 | Good evidence | Not available | Good evidence |
Embedded efficiency: primary evidence
6.9 Within the enhancements expenditure category National Highways reports efficiency for enhancements schemes when they open for traffic (OFT). For other enhancements (and all other areas of spend) the position is assessed based on cumulative spend compared to funding at the end of each year.
6.10 The cumulative £6m reported for enhancements in 2021-22 is £3m lower than the cumulative milestone. It is based on £26m from schemes OFT, offset by £20m inefficiency in other enhancements. National Highways has provided limited information supporting the calculation. The company will need to strengthen this evidence if the reported value grows as expected in future years.
6.11 National Highways has delivered more than its planned volumes of renewals of key assets (including pavement, safety barriers and significant structures) within its funding. Therefore, it has reported in-line with its efficiency cumulative milestone for 2021-22.
6.12 However, it is important that National Highways can show it takes a long-term view when making decisions on renewals. The company must consider the need to reduce whole-life costs. This includes how it decides which assets to replace, the treatment quality, and when the work is scheduled. On these issues the evidence of efficient delivery is less clear. Poor treatment quality decisions, as discussed in paragraph 2.31 will lead to inefficient renewals delivery.
6.13 On operations and business costs (capital expenditure) National Highways has reported efficiency above its planned cumulative level at year-end 2021-22. This is due to £9m of the £58m underspend being linked to efficiency. The remainder of the underspend is due to delays in lease renewals and digital services projects. SR21 removed and reprofiled funding from this category in 2021-22 due to these delays. However, the company did not consider this to be material and did not revise its milestone for 2021-22. The company has not provided sufficient evidence of how it has calculated its reported efficiency.
6.14 For expenditure on operations and business costs (operational expenditure) National Highways reported efficiency in-line with its plan at year-end 2021-22. The company spent below its cumulative funding on design, build, finance and operate (DBFO) routes (due to external factors) and staff vacancies. It used the underspend to deliver more maintenance and to meet cost pressures, including unfunded pressures, on Operation Brock.
6.15 National Highways was unable to show improved maintenance outcomes for its additional expenditure. The company noted that part of the additional expenditure was to recover routine maintenance standards on vegetation, lighting and drainage following the end of previous maintenance contracts. However, the company is delivering its core functions with fewer staff than budgeted and we conclude that its evidence is sufficient to support the reported efficiency.
Embedded efficiency: secondary evidence
6.16 National Highways has made progress in developing activity metrics as secondary evidence for renewals and enhancements:
- for enhancements the company has developed a model for reporting smart motorway activity metrics, made progress developing the same for Regional Investment Programme bypass and widening schemes and plans to extend this to junction improvement schemes; and
- for renewals the company has shown for four of the five key asset classes that it is delivering efficiency and has plans to extend this to the fifth asset class (concrete roads).
6.17 We want to see the company develop the models further and use them to compare efficiency performance with the level reported using primary evidence (see paragraphs 6.9 to 6.15).
6.18 The case studies presented by National Highways in RP2 provide supporting secondary evidence for the embedded efficiency reported. The company presented case studies supporting capital renewals, operational expenditure and non-roads capital expenditure. The studies cover a wide range of initiatives taking place in RP2. In some instances, the value of secondary evidence presented is below the reported efficiency. We will press the company to improve secondary evidence and assess it closely throughout RP2 to ensure it appropriately supports the primary reported value.
Table 6.2 Measured efficiency reported and our assessment of supporting evidence
| - | Reported cumulative (£259m) | Primary: case studies | Secondary: outputs and funding | Secondary: activity metrics |
|---|---|---|---|---|
| Carry-over | 191 | Good evidence | Not applicable | Not applicable |
| RP2 generated | 68 | Developing evidence | Not available | Not available |
Measured efficiency: primary evidence
6.19 National Highways’ £191m carry-over efficiency is supported by case studies and efficiency guides presented in RP1. The company has undertaken ongoing assurance of the reported efficiencies and it has updated some of the values (relating to RP2). We continue to review the company’s reported efficiencies for RP2 compared to the values it presented in RP1 to understand the reasons for any variances.
6.20 The £191m carry-over efficiency includes £75m of smart motorway enhancement efficiencies, as determined by a unit cost model that we reviewed and accepted in RP1. National Highways will update annually this reported efficiency to reflect any adjustments to efficiency values for the carry-over schemes as they OFT. In 2021-22 none of the schemes in the model were OFT and so no adjustment was made.
6.21 National Highways reported £68m of cumulative RP2 generated efficiencies in 2021-22. This is evidenced by case studies across several themes. So far in RP2, we have reviewed case studies with a total value of £42m. The company is progressing its remaining case studies related to the reported efficiency through its assurance process and expects to share them with us for review in 2022-23.
Measured efficiency: secondary evidence
6.22 National Highways has not yet provided any secondary evidence related to its delivery of outputs for funding, or activity metrics for measured efficiency.
6.23 It is important that going forward National Highways considers secondary evidence that it could present to support its reported position on measured efficiency. RP2 generated efficiency covers designated funds and enhancements, including complex Tier 1 schemes, such as Lower Thames Crossing and A303 Amesbury to Berwick Down (Stonehenge). The company expects these schemes and designated funds to contribute efficiency of £187m. This means that supporting evidence of how the company delivers outputs for funding and activity metrics is key to ensuring appropriate assessment of efficient delivery.
Other factors: inflation, capability and risk
6.24 In 2020-21 National Highways reported that the inflation it was exposed to was lower than the level assumed within RIS2 funding. This changed during 2021-22. The company’s modelling indicated that inflation is now higher than the level assumed in the funded position.
6.25 We agreed with National Highways that we will take account of inflation in assessing its efficiency performance using a similar approach to that used for RIS1. Any material difference between assumed inflation and inflation experienced by the company will lead to either an increase in efficiency and/or outputs, or recognition of an (inflation-driven) cost pressure when assessing performance. We will review this, and we expect the company to report a forecast of the inflation impact in later years of RP2.
6.26 National Highways intends to improve its capability internally and through its supply chain to deliver its RIS2 efficiency KPI. The company’s efficiency report identifies several change programmes (controlled through the wider Transformation Programme). We want to see the company outline its progress with these in future reports. The company reports that it continues to engage with government’s Transport Infrastructure Efficiency Strategy.
6.27 In 2021-22, we commissioned a review of how National Highways had used its CRR and the implications for how we scrutinise and the company reports its efficiency. The review recommended changes to reporting to better track the efficiency KPI over time. This would apply mainly to enhancements that are all back end loaded within RP2. This is where the company expects to use the vast majority of the CRR. We are discussing with National Highways what changes will be required from 2022-23.
Evidence assessment summary
6.28 Overall, National Highways has made progress in developing its efficiency evidence since 2020-21 and managing the changes in the efficiency KPI.
6.29 National Highways’ reported efficiency has grown in-line with its efficiency plans. The company must continue to focus on improving evidence in the areas set out in this chapter. This is particularly important for enhancements, renewals and operational expenditure. These are the areas of expenditure for which the company plans to make the largest efficiency claims in future.
Assessment of efficiency evidence RP2 forecast Collapse accordion Open accordion
6.30 National Highways has not provided an RP2 forecast of its efficiency performance. The company should report a forecast that considers the risks and opportunities it sees in the remainder of RP2. The company notes that there is considerable uncertainty at this point in its forecasts of costs and outputs. However, we are concerned that it has not provided a forecast or clearly articulated the uncertainty to funders and road users. This is key to the company’s transparent reporting of its performance in delivering RIS2 and to ensure that decision-makers have the information required for the development of RIS3. We had conversations with National Highways on this issue in 2021-22 and will continue to press the company to publish its RP2 forecast in 2022-23.
7. Looking ahead
7.1 Over the next year, we will maintain focus on the issues discussed elsewhere in this report. We have provided a summary of these issues below and we will report back in our 2022-23 annual assessment.
Holding to account: performance priorities in 2022-23 Collapse accordion Open accordion
7.2 On safety, Department for Transport (DfT) will publish its 2021 safety data in autumn 2022. We will publish a separate report on National Highways’ safety performance later in 2022. This report will set out the company’s performance against the safety key performance indicator (KPI) and associated injury and collision performance indicators (see chapter 1). The report will also talk to the safety of smart motorways (see paragraphs 7.17 to 7.19).
7.3 On asset management (see chapter 2), National Highways has yet to convincingly demonstrate to us how it is delivering the right asset renewal at the right time across the country. With the third road investment strategy (RIS3) likely to see an increase in the amount of renewals investment, confidence in that funding being efficiently utilised is of paramount importance. We will continue to challenge the company in this road period and through our advice to government on the development of RIS3.
7.4 We will hold National Highways to account for the roll-out of its renewals reporting tool in September 2022. The company told us that this tool will provide reporting that it is efficiently delivering its renewals asset interventions across all regions. We are engaging with the company’s regional teams to put this reporting in context once it becomes available. This will give us a better understanding of what the data means for asset performance. It is important to us that the reporting improvements demonstrate how asset management governance is embedded within the company. We expect National Highways to be fully cognisant of this.
7.5 On environmental performance, we will continue to challenge National Highways to produce a robust biodiversity plan in 2022-23. This must give us confidence that the company will deliver no net loss of biodiversity over the second road period (RP2). We will hold the company to account to deliver its plan. We will review upcoming changes to environmental requirements because of the Environment Act 2021. In July 2021, National Highways published its net zero carbon plan. We will hold the company to account to deliver it.
7.6 The company must ensure that its enhancements programme remains deliverable. It must have a robust plan to mitigate the challenges and risks detailed in chapter 4 and ensure that it minimises disruption to road users, non-road users and communities. We will continue to hold the company to account to ensure that it is doing everything it reasonably can to deliver these commitments.
7.7 We remain concerned at the risks associated with obtaining planning approvals. The robustness of development consent orders (DCO) and planning applications should be sufficiently comprehensive to address stakeholder concerns. Due to the risks to delivery, we will require more regular and timely updates of the DCO programme so we can assess the potential impact for future delivery commitments. We will hold the company to account to deliver the enhancements portfolio and the effectiveness of its planning risk mitigations.
7.8 National Highways will continue to provide progress updates against the recommendations detailed in our joint review of the company’s capability and capacity to plan and deliver the second road investment strategy (RIS2). There are outstanding transformation processes to integrate over the remainder of RP2. During 2022-23 we will assess the company’s progress against any remaining elements and lessons learned that it can apply to its third road investment strategy (RIS3) planning.
7.9 National Highways is due to complete 28 post-opening project evaluations (POPE) by March 2023. We will hold National Highways to account for the publication of its POPEs, as detailed in its programme.
7.10 We will require the company to address the financial risk of a large underspend in 2022-23 caused by further scheme delays. We need assurance that surplus funding in 2022-23 will not lead to surplus funding in RP2, risking it being reallocated to other government priorities.
7.11 We will hold National Highways to account to improve its management, forecasting and reporting of the Central Risk Reserve (CRR) during RP2 to ensure it has robust processes and governance in place to manage financial risks. We will also consider within our draft RIS3 advice to DfT how the CRR should be used alongside other risk allocations to provide the right incentives for managing risk during the third road period (RP3).
7.12 Inflation is one of the largest external financial risks impacting National Highways in RP2. We will continue to press the company to provide further transparency over its assessment of inflation in RP2 and how it will mitigate its impact for RP2 and future road periods.
7.13 We expect National Highways to improve its reporting of efficiency evidence in 2022-23 and place a much greater focus on its forecast performance against the KPI. This should include an assessment of risks to future efficiency, in particular from challenges in delivering the RIS2 enhancement programme and financial risks that may impact use of the CRR in the remaining years of RP2. We will scrutinise the company’s progress in this area.
7.14 We will examine how National Highways manages delay on its roads that serve ports and airports. This could include the impact of disruption on the network if post-EU exit border controls on goods entering the country are phased in.
7.15 With the strategic roads user survey (SRUS) target suspended for 2022-23, the third year in a row, we will work with National Highways and Transport Focus to agree on reintroducing a target in 2023-24. This is dependent on a longer time series of data following a change in data collection since the coronavirus (COVID-19) pandemic.
7.16 National Highways is over-programming its designated funds spend in 2022-23 to ensure that it uses its total budget. We will hold the company to account for its progress in delivering its designated fund projects across the remainder of RP2.
Safety of smart motorways Collapse accordion Open accordion
7.17 We will continue to hold National Highways to account to deliver the smart motorway action plan. Where it has completed actions, we expect to see the company embed new processes into its business as usual delivery. The company has engaged with the public on smart motorway safety, with national campaigns and improved communications. We will scrutinise what the company does in 2022-23 to ensure road users are adequately educated.
7.18 We will work with DfT and National Highways to deliver the recommendations from the Transport Select Committee’s report on the roll-out and safety of smart motorways. This includes whether we should have a strategic health and safety role for the roads, as we do for the rail network.
7.19 Government is currently investigating the benefits of a health and safety assessment being undertaken by us before changes to design or operational standards are implemented on the strategic road network (SRN). We will evaluate the success of the smart motorway action plan and the effectiveness and operation of stopped vehicle detection technology.
Developing RIS3 Collapse accordion Open accordion
7.20 RIS3 will cover RP3, from April 2025 to March 2030. The process of developing RIS3 is divided into seven steps as shown in figure 7.1.
Figure 7.1 Steps in the RIS3 development process
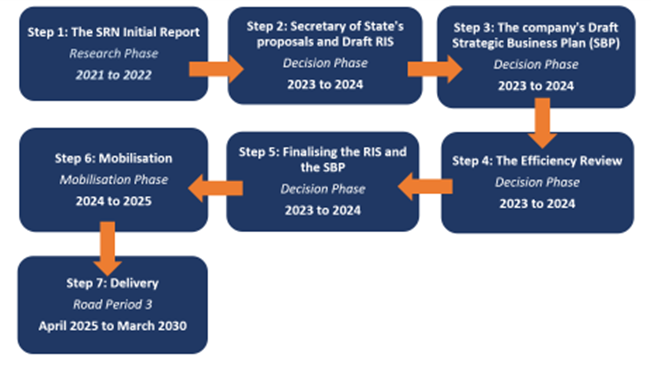
7.21 The first formal stage in the RIS3 setting process is the development of the SRN Initial Report, as required under National Highways’ licence. The report contains an assessment of the current state of the network and users’ needs, potential maintenance and enhancement priorities, and future development needs and prospects. We expect the company to publish its SRN Initial Report later in 2022. The Secretary of State will consult on the document.
7.22 In 2022-23, National Highways will start preparing its RIS3 draft Strategic Business Plan (SBP). We expect the quality of National Highways’ plans to reflect its maturity as a company entering its third road period. In summer 2022 we will set out guidance on the evidence we expect National Highways to include in its draft SBP and will continue to work closely with the company, and other key parties, to ensure the success of the RIS3 process.
Annex A: Financial Performance
A.1 This annex discusses:
- changes to National Highways’ funding for the second road period (RP2);
- how the company spent its 2021-22 funding;
- its forecast capital expenditure for RP2;
- its forecast total outturn expenditure for its enhancements portfolio; and
- the financial risks the company faces in RP2.
Overview of funding changes in RIS2 Collapse accordion Open accordion
A.2 During 2021-22, government changed the level of funding provided to National Highways to deliver its second road investment strategy (RIS2). Chapter 4 and annex B discuss the related substantive changes to enhancements schemes commitment dates.
A.3 The most significant funding change occurred at Spending Review 2021 (SR21) in October 2021. The government reduced RIS2 funding by £3,494m (capital expenditure £3,429m and operational expenditure £65m). The main reason for the change was the slippage on a small number of high value enhancements schemes. This created a large forecast underspend of £1,846m (at Q2 2021-22).
A.4 In summer 2021 National Highways told government that it would expect the underspend to increase over RP2. This was due to the challenges it faced obtaining planning consents for some schemes. Figure A.1 shows this and other changes that government made to the company's funding using SR21:
Figure A.1 Funding changes at SR21 (£ million)
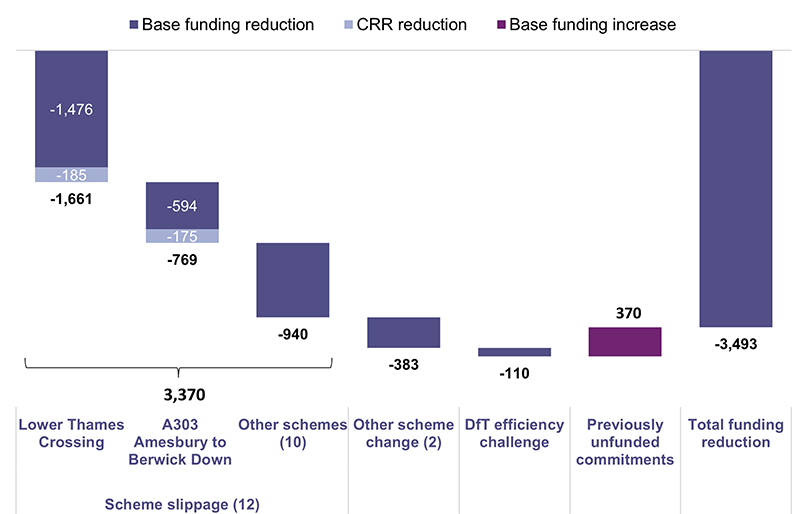
A.5 In addition to the changes driven by scheme slippage, government also made funding changes to two schemes identified as being poor value for money and made a further reduction as part of a government-wide efficiency challenge (discussed in paragraph 6.3). The £3,863m decrease was partially offset by a reallocation of £370m to unfunded enhancements commitments in RIS2.
A.6 Figure A.2 shows that the funding reduction also reprofiled annual allocations for RP2. However, the RP2 profile remains back end loaded, thought the position has improved. National Highways expects to spend 20% more in 2024-25 than in 2021-22.
Figure A.2 Annual funding profile at the start of RP2 and as revised at SR20 and SR21 (£ million)
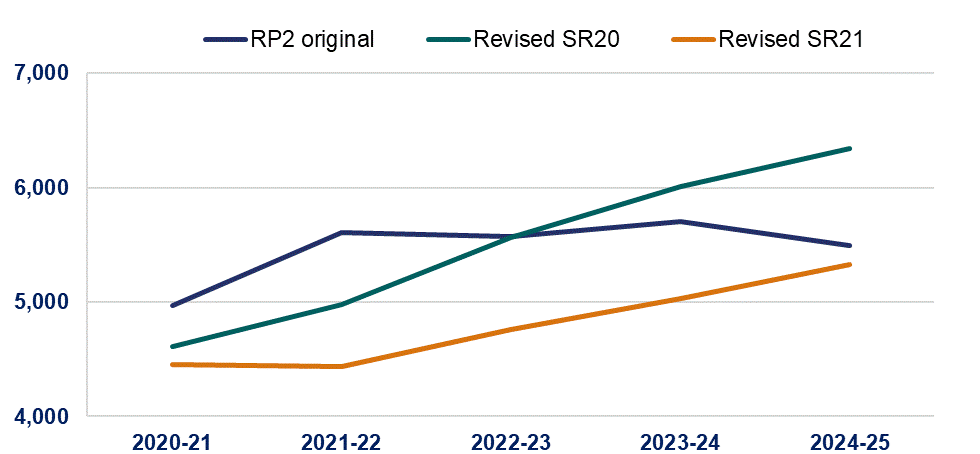
A.7 Government made a further substantive change to RIS2 in Q4 2021-22 when it accepted the Transport Select Committee’s (TSC) recommendations on the roll-out and safety of smart motorways (discussed in chapter 1). A pause to the roll-out of smart motorways not yet in construction freed up funding for National Highways to use for other priorities on the strategic road network (SRN), including smart motorway safety improvements. This did not change the overall level of funding for RIS2, but it may require further movements of funding between years. The company has the authority to manage this using its capital-flex facility. This allows 10% of annual capital funding to be moved between years of RP2.
2021-22 funding Collapse accordion Open accordion
A.8 National Highways’ 2021-22 pre-SR21 budget was £4,990m. This was split £1,173m for resource expenditure and £3,817m for capital expenditure.
A.9 SR21 resulted in £556m being reprofiled out of 2021-22 capital funding into later years of RP2. This resulted in a post-SR21 capital funding of £3,261m.
A.10 National Highways was subsequently left with an additional £75m underspend. The company used its capital-flex facility to remove this from its 2021-22 budget and expects to have it returned to the company in later years of RP2. This resulted in a final outturn for 2021-22 of £3,186m.
Figure A.3 Capital expenditure reprofiling and underspend 2021-22 (£ million)
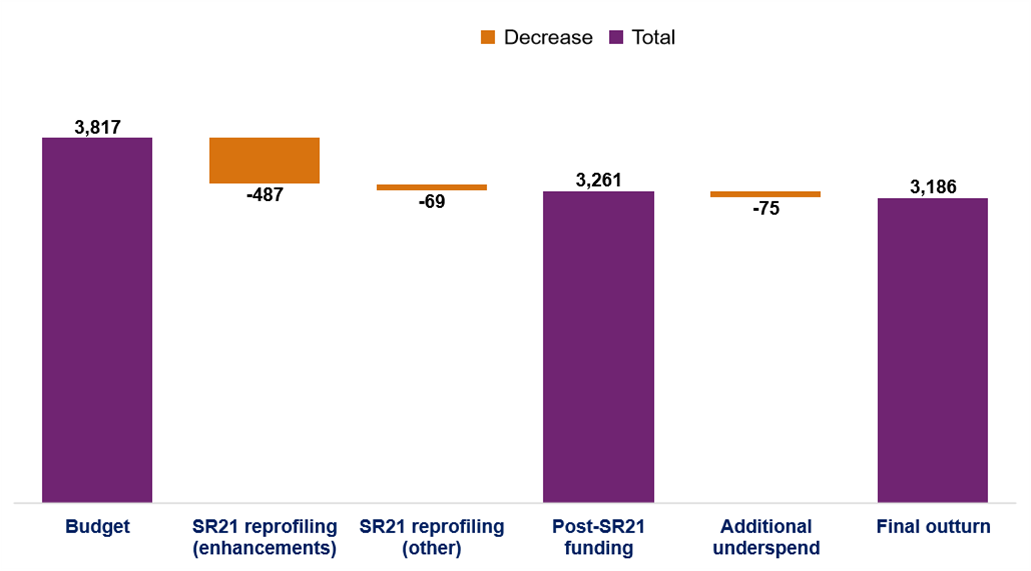
A.11 Of the initial £556m underspend that National Highways identified, £487m was related to forecast underspends on enhancements. This was mostly due to planning delays on enhancements projects (see paragraph 4.13). Other underspends include £47m against designated funds (see paragraph 5.58).
2021-22 capital expenditure Collapse accordion Open accordion
A.12 National Highways set an original 2021-22 capital expenditure budget of £3,817m. SR21 reprofiled funding out of 2021-22 and into later years of the road period. The post-SR21 budget was £3,261m. The company spent £3,186m, an underspend of £75m against the post-SR21 budget. Figure A.4 shows underspends against all categories of expenditure except other capital.
Figure A.4 Capital expenditure against 2021-22 budget (£ million, rounded)
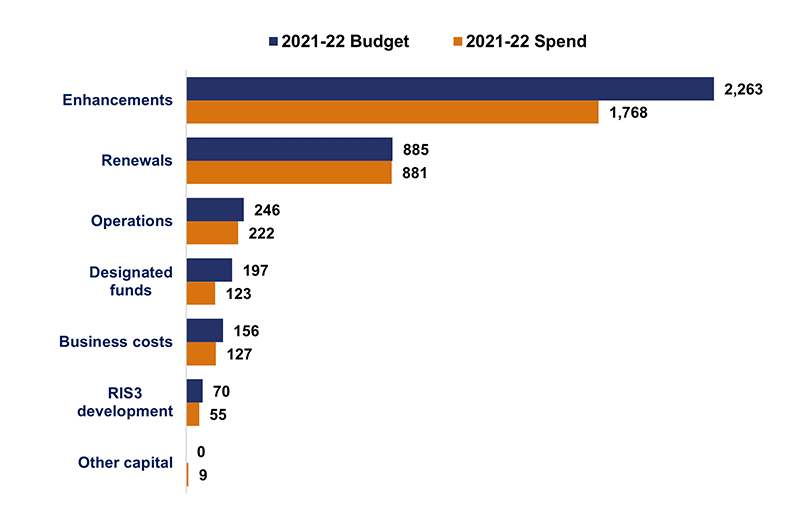
Enhancements
A.13 National Highways spent £1,768m on enhancements in 2021-22. This was £494m (21.9%) less than it planned. Of this underspend, £487m was part of the £556m SR21 reprofiling. The company anticipated additional underspend against the enhancements category after the SR21 reprofiling but was able to minimise this to only £7m. This was partly because there were project delivery risks that did not materialise.
A.14 This enhancements category includes, but is not limited to, expenditure on delivering enhancement schemes. In 2021-22, National Highways spent more than £25m on 20 enhancements schemes. Figure A.5 shows the expenditure on and the phase of the schemes at year-end 2021-22. As we would expect, most of the high expenditure schemes are currently in construction. This is where the most expenditure incurs.
A.15 There is a small number of large and/or complex enhancements schemes in development that had spend greater than £25m in 2021-22. The largest is Lower Thames Crossing where the company spent £137m. This related to several areas, such as work on carbon emissions, advance construction costs and land purchases.
Figure A.5 Enhancement schemes with in-year spend greater than £25m by scheme phase at year-end 2021-22 (£ million)
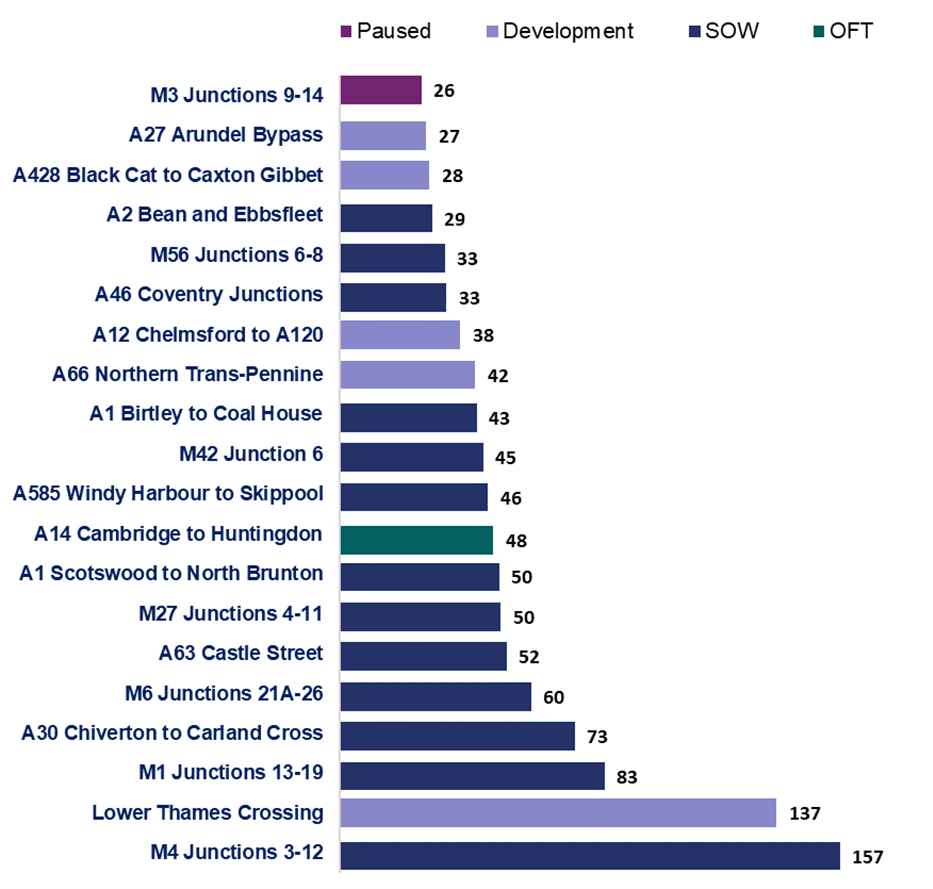
Third road investment strategy (RIS3) development
A.16 National Highways spent £55m on RIS3 enhancements development in 2021-22. This was £15m (21.6%) less than it planned due to a delay putting in place the resources and contracts to commence and progress the pipeline schemes.
Renewals
A.17 National Highways spent £881m on renewals in 2021-22, £3m (0.4%) less than planned. The Yorkshire and North-East region underdelivered by £16.5m due to difficulties rolling out its Asset Delivery (AD) model. The East region’s delivery of its concrete programme was slower than planned, resulting in a £70m underspend. The company managed these underspends by bringing forward other renewals delivery across other regions.
Designated funds
A.18 National Highways spent £123m on designated funds in 2021-22. This was £73m (37.3%) less than the company planned. However, £47m of this underspend was reprofiled as part of SR21. The remaining £27m was due to underspends across all four designated funds (for full details see paragraphs 5.56 to 5.64).
Business costs
A.19 National Highways spent £127m on business costs in 2021-22. This was £30m (18.9%) less than it planned. The largest contributor was £17m from two property leases. One lease is no longer planned for RIS2, and the other was previously brought forward into 2020-21.
Operations
A.20 National Highways spent £222m on operations in 2021-22. This was £24m (9.7%) less than it planned. This was due to spending £7.4m less than planned on staff costs and other underspends. This was slightly offset by £3.6m of overspends related to smart motorway costs that were incurred without budget.
Other capital expenditure
A.21 National Highways spent £9m on ancillary works related to Operation Brock in 2021-22. This was £9m more than it budgeted for at the start of 2021-22.
2021-22 resource expenditure Collapse accordion Open accordion
A.22 In 2021-22, National Highways spent £1,177m on resource. This was an overspend of £3m. Figure A.6 shows how underspends on some categories, were offset by overspends on others.
Figure A.6 Resource expenditure against 2021-22 budget (£ million, rounded)
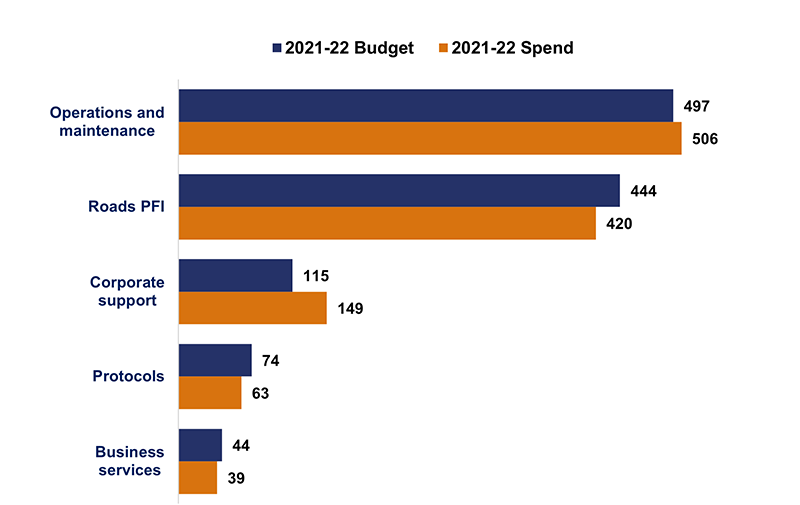
PFI – private finance initiative
Operations and maintenance
A.23 National Highways spent £506m on operations and maintenance in 2021-22. This was £8m (1.7%) more than it planned. A £26m overspend against maintenance was offset by a £16m underspend against operations.
A.24 The operations underspend was due to fewer employees than planned transferring into National Highways (Area 12) because of the roll-out of its AD model.
A.25 The maintenance overspend was a consequence of the company repurposing underspends elsewhere, for example on private finance initiatives (PFI) to increase maintenance spend. Paragraphs 2.39 to 2.43 provide further details of maintenance delivery.
PFI contracts
A.26 National Highways spent £420m on PFI contracts in 2021-22. This was £24m (5.5%) less than it planned. It was due to the impact of the coronavirus (COVID-19) pandemic on traffic levels. Under the contracts, lower traffic volumes lead to lower service charges. The company also made a £2m saving on the repayment element of contracts. Paragraphs 2.51 to 2.54 provide further information on the company’s PFI contracts.
Corporate support
A.27 National Highways spent £149m on corporate support in 2021-22. This was £35m (30.2%) more than it planned. It was largely because this category holds the £17m overspend anticipated when the 2021-22 business plan was agreed. This is also where the company recorded its £7m unfunded spend on Operation Brock.
Business services
A.28 National Highways spent £39m on business services in 2021-22. This was £5m (11.1%) less than it planned. This included £3.9m of deferred income from 2020-21 that the company reported in 2021-22. The income related to a European Union rebate.
Protocols
A.29 The Secretary of State for Transport requires National Highways to perform protocols services on their behalf. These cover functions or activities that are not core to its role as a strategic highways company. The company spent £63m on protocols in 2021-22. This was £10m (13.8%) less than it planned. It was mostly due to lower service charges because of lower traffic volumes on the Dartford Crossing.
2021-22 expenditure on enhancement schemes Collapse accordion Open accordion
RP2 capital funding and baseline
A.30 As a result of SR21 government reduced National Highways’ RP2 total funding from £27,505m to £24,008m. Within the £3,496m reduction, £3,431m was capital funding and £65m was revenue funding. Following SR21, National Highways has a capital funding allocation of £18,000m for RP2.
A.31 National Highways reports financial performance externally against its baseline expenditure plan for RP2. The company made a major revision to its baseline in Q4 2021-22 because of in-year changes agreed by government to RIS2 commitments, mostly linked to SR21 and smart motorways.
A.32 Figure A.7 compares National Highways’ post-SR21 funding profile and its RP2 capital baseline (v3.1). The difference reflects a different spending profile for the smart motorway changes and further scheme slippage since SR21.
A.33 The £106m difference between baseline and funding in 2022-23 indicates that National Highways expects to underspend its 2022-23 funding. Early 2022-23 financial reporting shows that the company is forecasting a significantly larger underspend. This will need to be reduced if it wishes to make use of capital-flex to move funding to later years (see paragraph A.7).
Figure A.7 Capital funding post-SR21 and capital baseline (£ million)
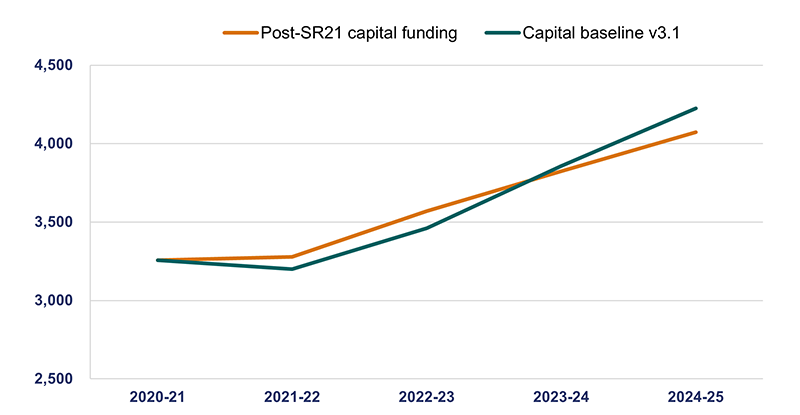
A.34 National Highways’ overall capital funding includes a central risk reserve (CRR) that the company holds separately to the core funding provided by government for delivering the capital programmes in RIS2. When the company identifies a portfolio level risk or other risk for which it does not have funding within its programmes, it can make provision from the CRR to increase programme or project budgets. This means that National Highways will report against the higher budget. However, budget holders will need to seek separate internal corporate approval if the risk materialises, to drawdown the funding to meet the higher cost.
RP2 capital expenditure forecast Collapse accordion Open accordion
A.35 At year-end 2021-22 National Highways forecast that it would spend £17,984m in RP2 against its capital funding allocation and baseline of £18,042m (base and CRR). This is an underspend of £58m (0.3%). However, the company reports expenditure against its capital baseline, including base funding and provisioned CRR (the portion it expects to use in RP2). Figure A.8 shows that against this lower baseline of £17,748m, the company forecast an overspend of £236m (1.3%).
Figure A.8 RIS2 capital baseline (including CRR provision) and forecast variance at year-end 2021-22 (£ million)
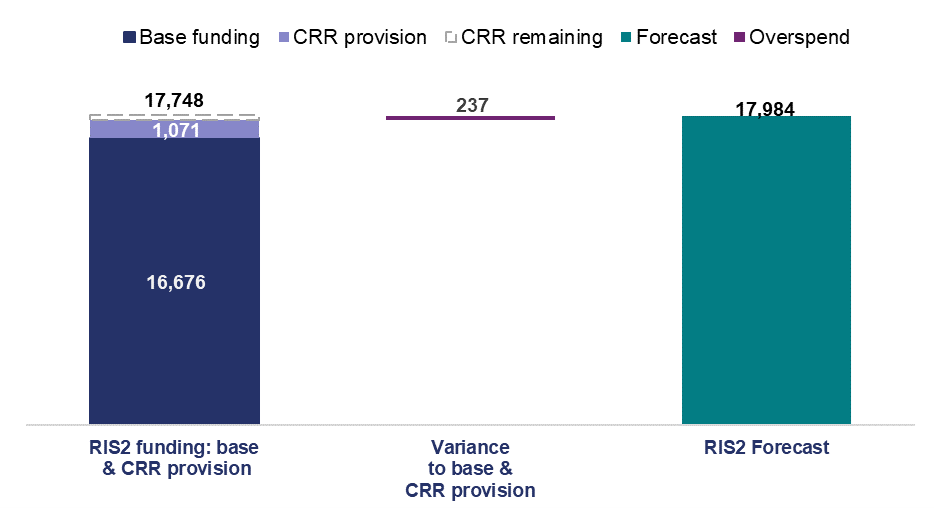
A.36 National Highways’ capital overspend is in its enhancements portfolio. It is comprised of the following:
- forecast £86m overspend on 69 enhancements schemes with RP2 delivery milestones; and
- forecast £151m overspend on other enhancements, including smart motorway action plan deliverables, legacy costs of previously completed projects, contributions to schemes delivered by third parties and safety and congestion works deferred from the first road period.
A.37 The 69 enhancements schemes have a total RP2 baseline including CRR provision of £9,098m. Figure A.9 shows that these schemes are forecast to spend £9,184m across RP2, a forecast overspend of £86m (1%). This overspend is mostly driven by a small number of enhancements schemes with large variances. Of the 69 enhancements schemes 78% are forecasting RP2 spend within 10% under or over their RP2 baseline. However, this partly reflects most of the schemes’ baselines being adjusted through use of the CRR.
Figure A.9 RP2 enhancement scheme baseline and forecast at year-end 2021-22 (£ million)
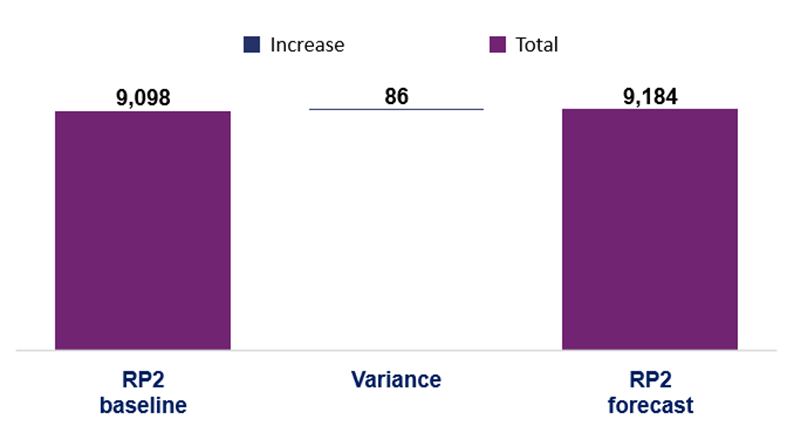
A.38 The largest forecast underspend is £251m on the Lower Thames Crossing. This represents 21% of the post-SR21 RP2 baseline. This forecast underspend is due to planning delays on the scheme.
A.39 The largest forecast overspend is on the A1 Morpeth to Ellingham. This scheme is currently forecasting spend of £255m against a RP2 baseline of £39m. Table B.4 provides further information about the scheme’s status.
A.40 During 2020-21 and 2021-22 National Highways reported a reduction in its forecast expenditure on enhancements for RP2. As set out in chapter 4, this generally reflects the impact of delays to schemes achieving planning consent when in development. This caused the company to move cost from RP2 to RP3 and led to government removing funding in SR21.
A.41 At the start of RP2 the company expected a third of the cost to fall in RP3 and beyond. At year-end 2021-22, the cost of delivering the RIS2 portfolio is now shared broadly equally between RP2, and RP3 and beyond. This will have implications for the setting of the RIS3 enhancements programme. Figure A.10 shows these changes. It also shows that as SR21 has reduced the RP2 funding, the forecast is now above the baseline and CRR provision by £237m.
Figure A.10 RIS2 schemes forecast cost reducing in RP2 and increasing in RP3 (£ million)
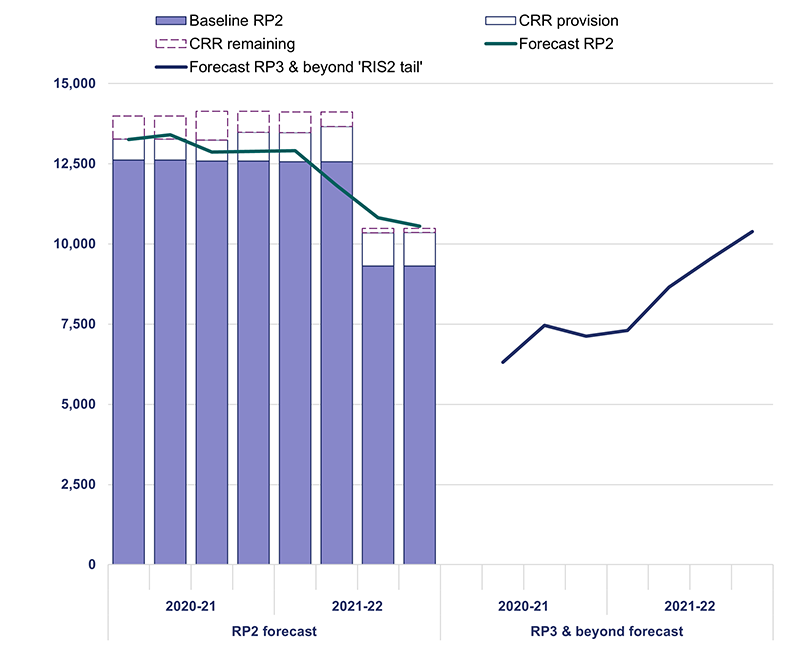
Total outturn capital forecast expenditure Collapse accordion Open accordion
A.42 The total forecast outturn cost of RIS2 enhancements is £25,388m, made up of £22,957m for enhancement schemes and £2,430m for other enhancements. This has increased by 5% since the start of RP2. However, this is not consistent across all the enhancement scheme programmes (that make up 90% of enhancements expenditure). Figure A.11 shows that the whilst the forecast cost has increased for the Complex Infrastructure Programme (11%) and Regional Investment Programme (6%), it has decreased for the Smart Motorway Programme (-19%) and Operations (-2%). The largest increases are on schemes impacted by planning delays. The decrease in forecast cost of smart motorways is due to the decision to pause schemes not yet in construction.
Figure A.11 Change in total outturn forecasts by programme since the start of RP2 (£ million)
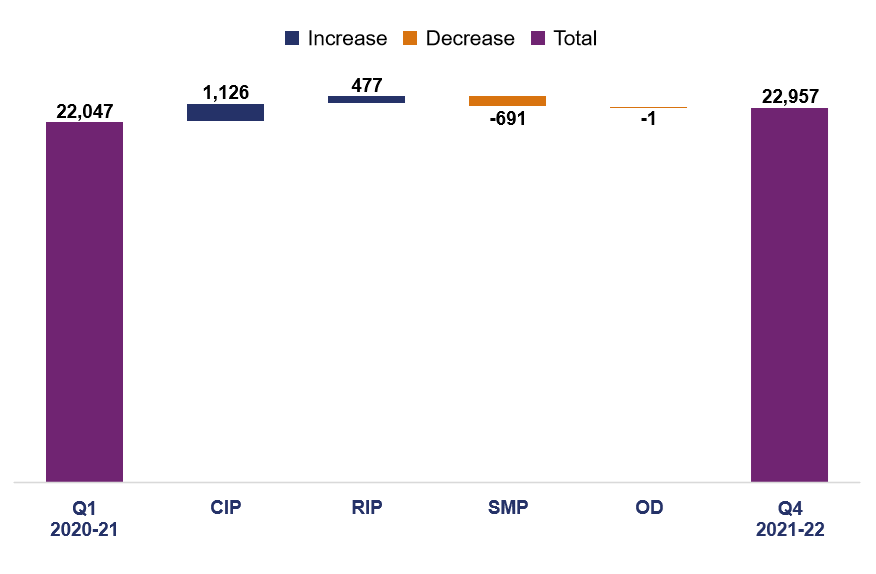
A.43 Figure A.12 shows at year-end 2021-22, the schemes with the largest change in total outturn forecast since the start of RP2. The largest change is related to the Lower Thames Crossing scheme. This increased by £1,009m (17%).
A.44 There are four schemes where the forecast total outturn has reduced by greater than £50m since Q1 2020-21. These are all smart motorway schemes that government announced it would pause in January 2022.
Figure A.12 Change in total outturn forecast from Q1 2020-2021 to Q4 2021-2022 for schemes where variance is over £50m (£ million)
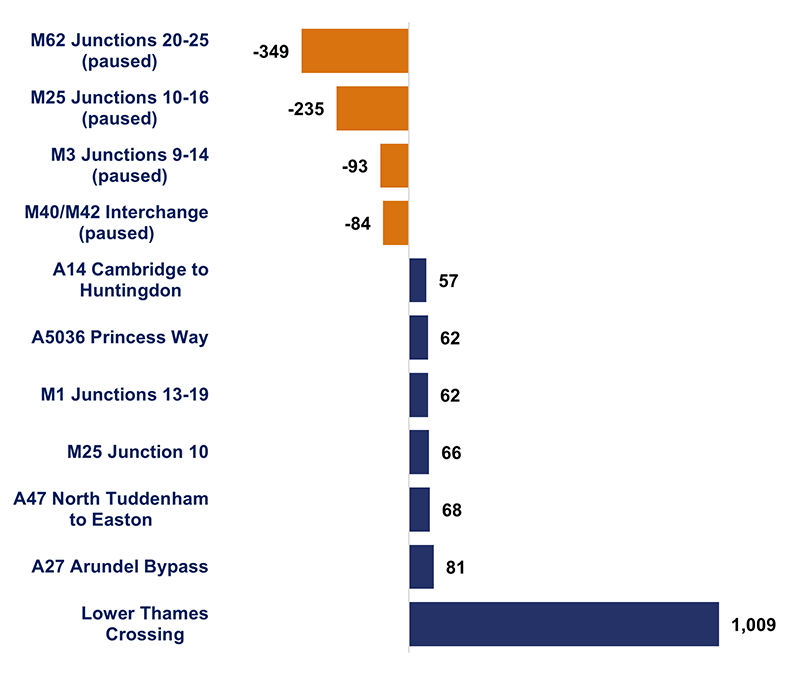
Central Risk Reserve (CRR) Collapse accordion Open accordion
A.45 National Highways’ overall capital funding includes a central risk reserve (CRR) that the company holds separately to the core funding provided by government for delivering the capital programmes in RIS2. The CRR provides for portfolio risks and other risks not covered as part of base funding. It is split into allocations for Lower Thames Crossing, enhancements, renewals and RIS3 development.
A.46 At the start of RP2 the CRR contained £1,541m. During 2020-21 National Highways made provision from the reserve of £935m for anticipated future risks. It also increased the balance by £175m using a transfer from base funding due to anticipated future risk on the A303 Amesbury to Berwick Down (Stonehenge) scheme. This left a balance of £781m at the end of 2020-21.
A.47 In 2021-22 the SR21 funding reduction impacted the CRR. National Highways removed all the Lower Thames Crossing £185m CRR funding and a further £166m for other enhancements. The company made provision of £136m for enhancements from the CRR in 2021-22. For the remainder of RP2 this leaves a balance of £294m, split between £130m for enhancements, £129m for renewals and £35m for RIS3 development.
Figure A.13 Changes in CRR provision in RP2 (£ million)
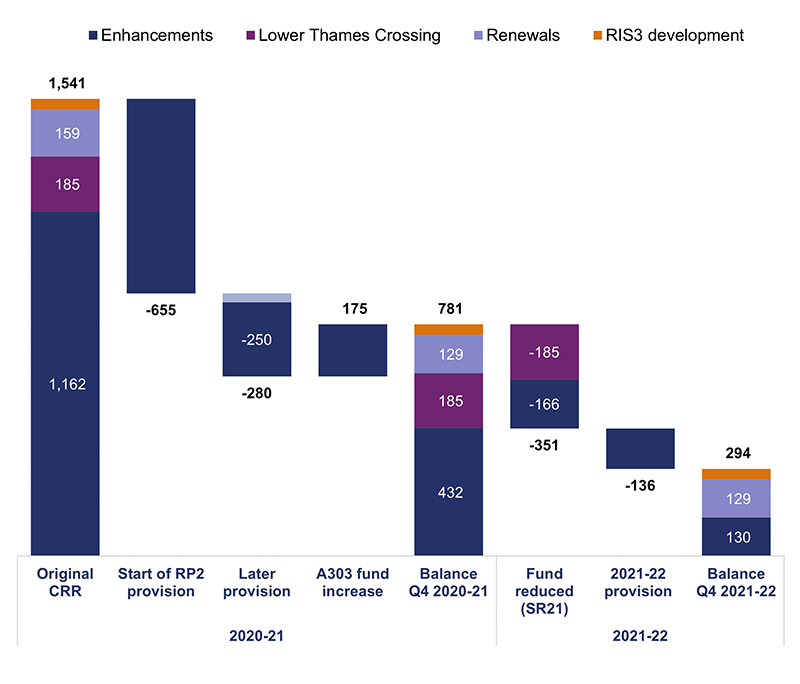
A.48 We are concerned that the 11% of the enhancements reserve remaining may not be sufficient for unidentified future enhancements risks in RP2. It represents 2% of RIS2 enhancements funding for the remaining years of RP2. National Highways reports that based on its current forecasts it believes it has sufficient funding to deliver the RIS. It sees continuing high inflation as the most significant risk.
A.49 The company also notes that it does not expect the high levels of CRR provision in the first two years of RP2 to continue. This is because the enhancements portfolio is significantly more mature in its development than it was in April 2020. This means that most of the risk will have been identified, mitigated or met through prior CRR provision. Also, there are now more schemes that have achieved start of works (SOW), where risk is often shared with contractors, or open for traffic (OFT). At the end of 2021-22 there were 25 schemes in development compared to 43 at the start of RP2. The rate of CRR provision appeared to reduce towards the end of 2021-22, beyond the level that we would expect from the portfolio changes in 2021-22.
Delegated expenditure controls Collapse accordion Open accordion
A.50 Government requires National Highways to conduct a self-assessment review of its compliance with the assurance arrangements set out in paragraphs 7.2 to 7.8 of the 2015 Framework Document. These arrangements include the financial controls that the company is required to have in place to reflect the broader level of delegated authority to incur expenditure on behalf of DfT. The company must declare within its annual Performance Monitoring Statements (PMS) whether it maintains an effective assurance regime for the expenditure of public money and that its decision making meets the criteria set out in the framework document.
A.51 National Highways has shared its 2021-22 self-assessment report with us. It shows that the company has an established and robust framework in place to ensure appropriate control of delegated authority to invest and that key investment decisions are made in-line with due governance and control processes. We are content that the review supports the declaration in the 2021-22 PMS.
Annex B: Enhancements delivery
B.1 This annex provides additional detail to chapter 4 on National Highways’ performance against its delivery plan for 2021-22. It also considers risks to the company’s delivery during the remainder of the second road period (RP2).
B.2 The second road investment strategy (RIS2) sets out the objectives and enhancements that National Highways must deliver over RP2. It outlines how the company will spend its five-year capital funding settlement on improving the strategic road network (SRN). Figure B.1 shows how Spending Review 2021 (SR21) reduced the funding for RIS2 and increased the scheme development fund for the third road period (RP3). Paragraph B.15 provides further detail about the changes government made to the company’s enhancements scheme commitments.
B.3 In July 2020 National Highways published its first delivery plan for RP2. This set out how the company planned to deliver its RIS2 requirements. The delivery plan is updated on an annual basis. It sets out the changes the company has agreed with government and when it will meet key milestones. We scrutinise and report on the company’s performance against its delivery plans.
Figure B.1 Comparison of RIS2 funding in delivery plan updates 2021-22 and 2022-23 (post-SR21) (£ million)
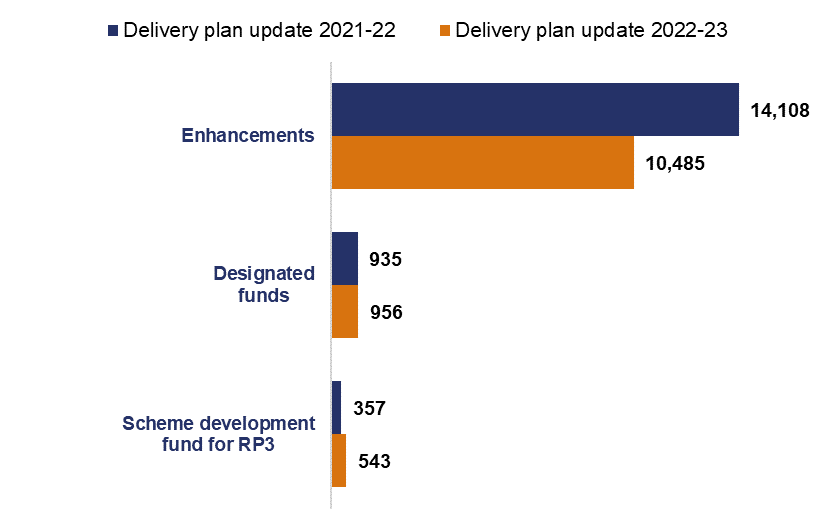
Enhancements portfolio overview Collapse accordion Open accordion
B.4 National Highways is responsible for progressing the delivery of 69 enhancement schemes during RP2. The original RIS2 (RIS2 2020) committed the company to achieve start of works (SOW) on 43 schemes and open for traffic (OFT) 52 schemes during RP2. These enhancements are intended to improve capacity and connectivity across the SRN, for example by:
- improving junctions;
- adding new lanes;
- opening the hard shoulder for traffic; and/or
- bypassing congested parts of the network.
B.5 National Highways delivers or supports the delivery of four third party schemes and five Housing Infrastructure Fund (HIF) schemes. These schemes are associated with both commercial and residential developments or are a part of the HIF that specifically targets housing provision. Table B.1 lists these schemes. It includes one scheme that achieved SOW in the first road period (RP1).
Table B.1 Third party and HIF schemes
| Schemes | Scheme type | SOW | OFT |
|---|---|---|---|
| M55 Junction 2 | Third party | RP1 (started) | 2023-24 |
| M11 Junction 7a | Third party | Q2 2020-21 (started) | 2022-23 |
| M62 Junction 19 | Third party | Q3 2020-21 (started) | 2022-23 |
| A5 Towcester Relief Road | Third party | Q4 2021-22 (started) | RP3 |
| A249 Swale Transport Infrastructure | HIF | 2021-22 (starting in 2022-23) | 2024-25 |
| A120 Tendring/Colchester Borders Garden Community | HIF | 2022-23 | 2024-25 |
| M5 Junction 10 and Link Road | HIF | 2022-23 | 2024-25 |
| M6 South Lancaster Growth Catalyst Junction 33a | HIF | 2024-25 | RP3 |
| A5 Dordon to Atherstone* | HIF | RP3 | RP3 |
* to be delivered by National Highways
Enhancements delivery 2021-22 Collapse accordion Open accordion
SOW and OFT
B.6 Chapter 4 sets out changes to National Highways’ scheme commitments during 2021-22 and across the remainder of RP2. Figure B.2 shows schemes achieving SOW compared to the company’s updated commitments as agreed with government at year-end 2021-22. Figure B.3 shows schemes OFT on the same basis.
Figure B.2 Map of scheme SOW changes for 2021-22
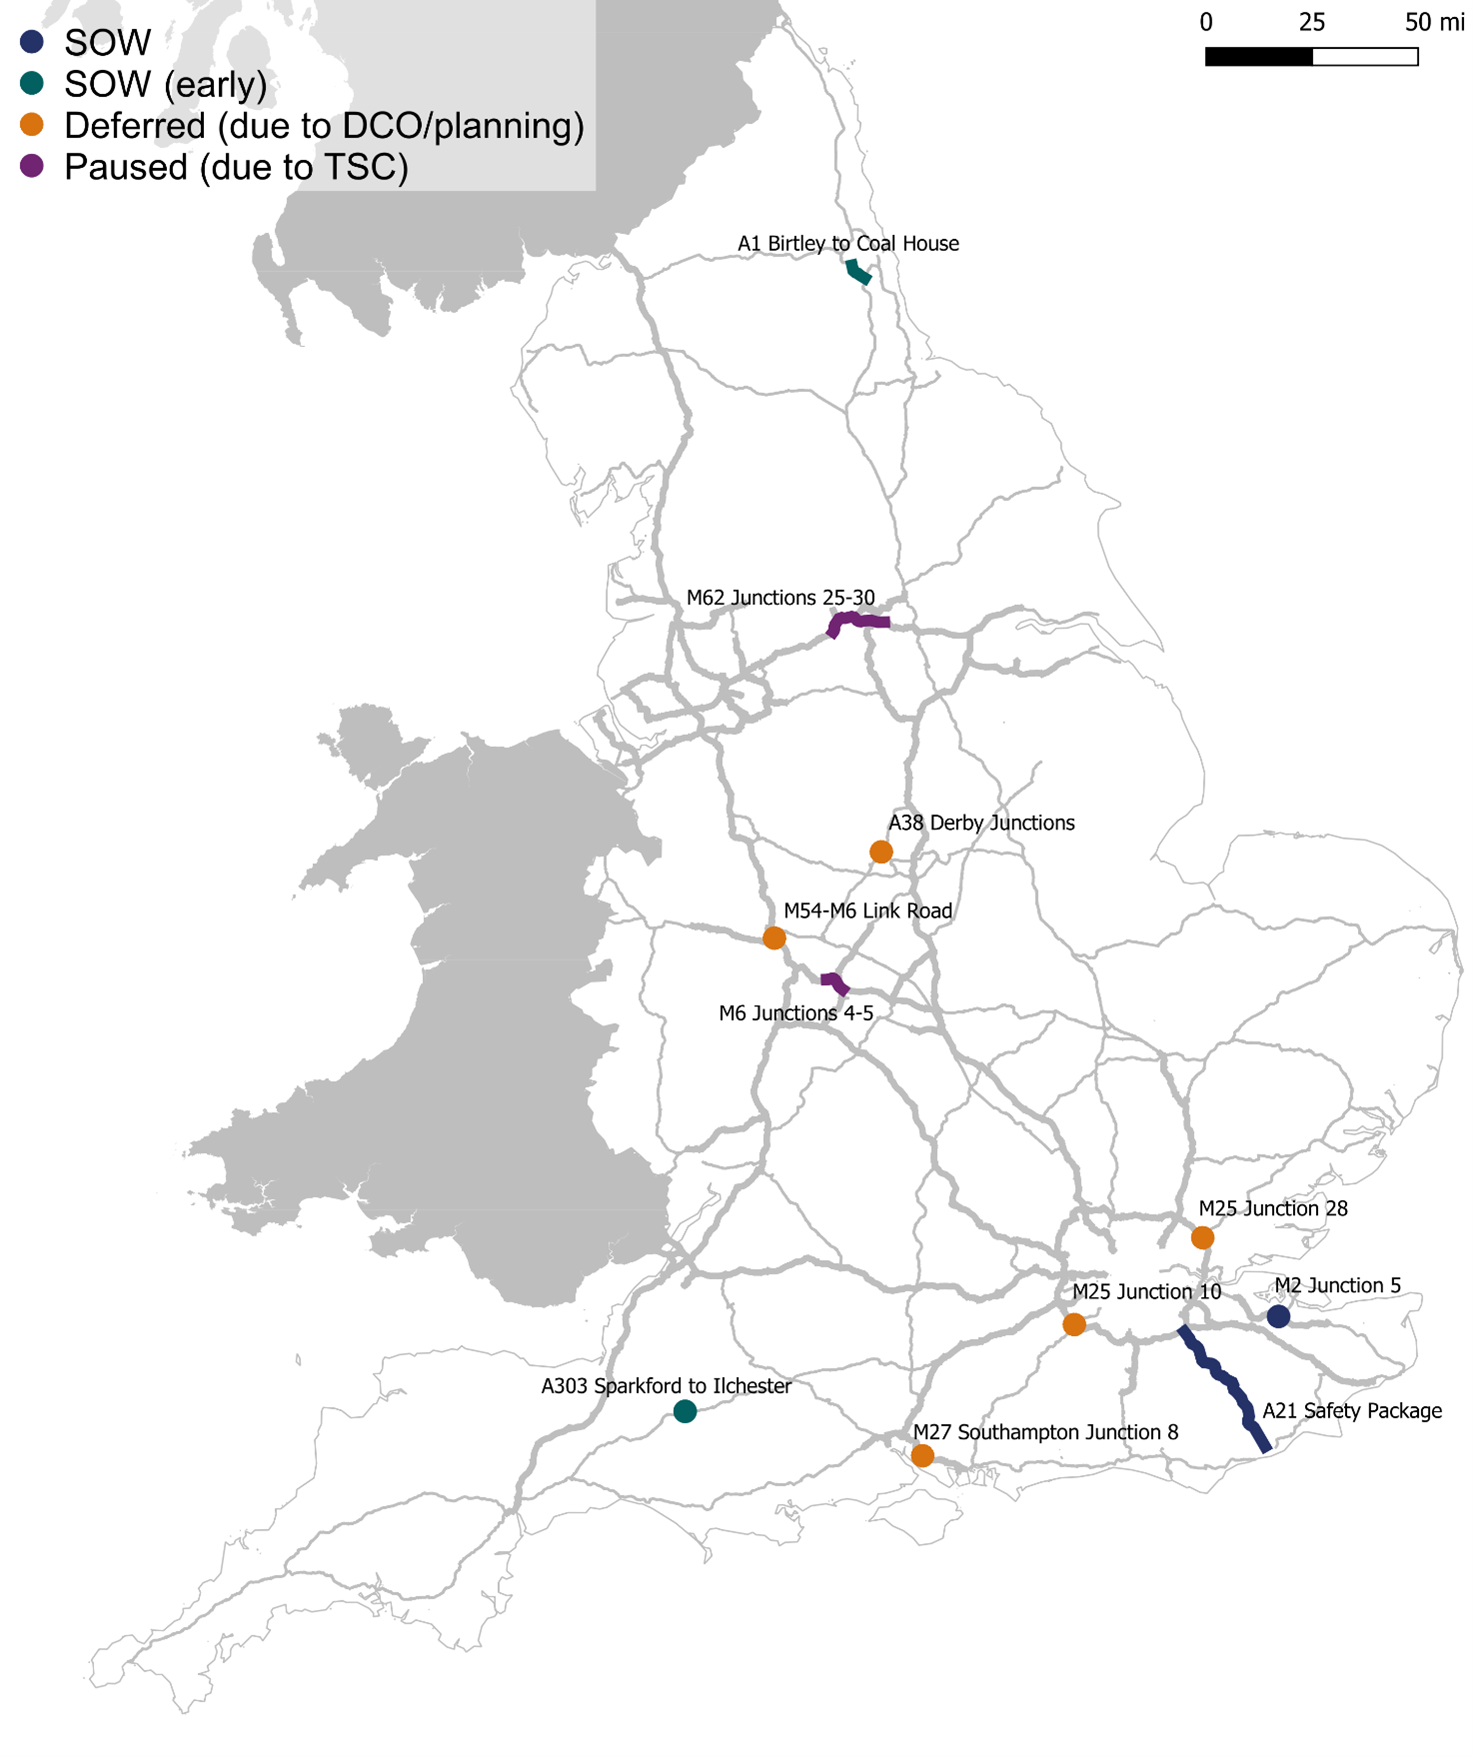
Figure B.3 Map of scheme opening status 2021-22
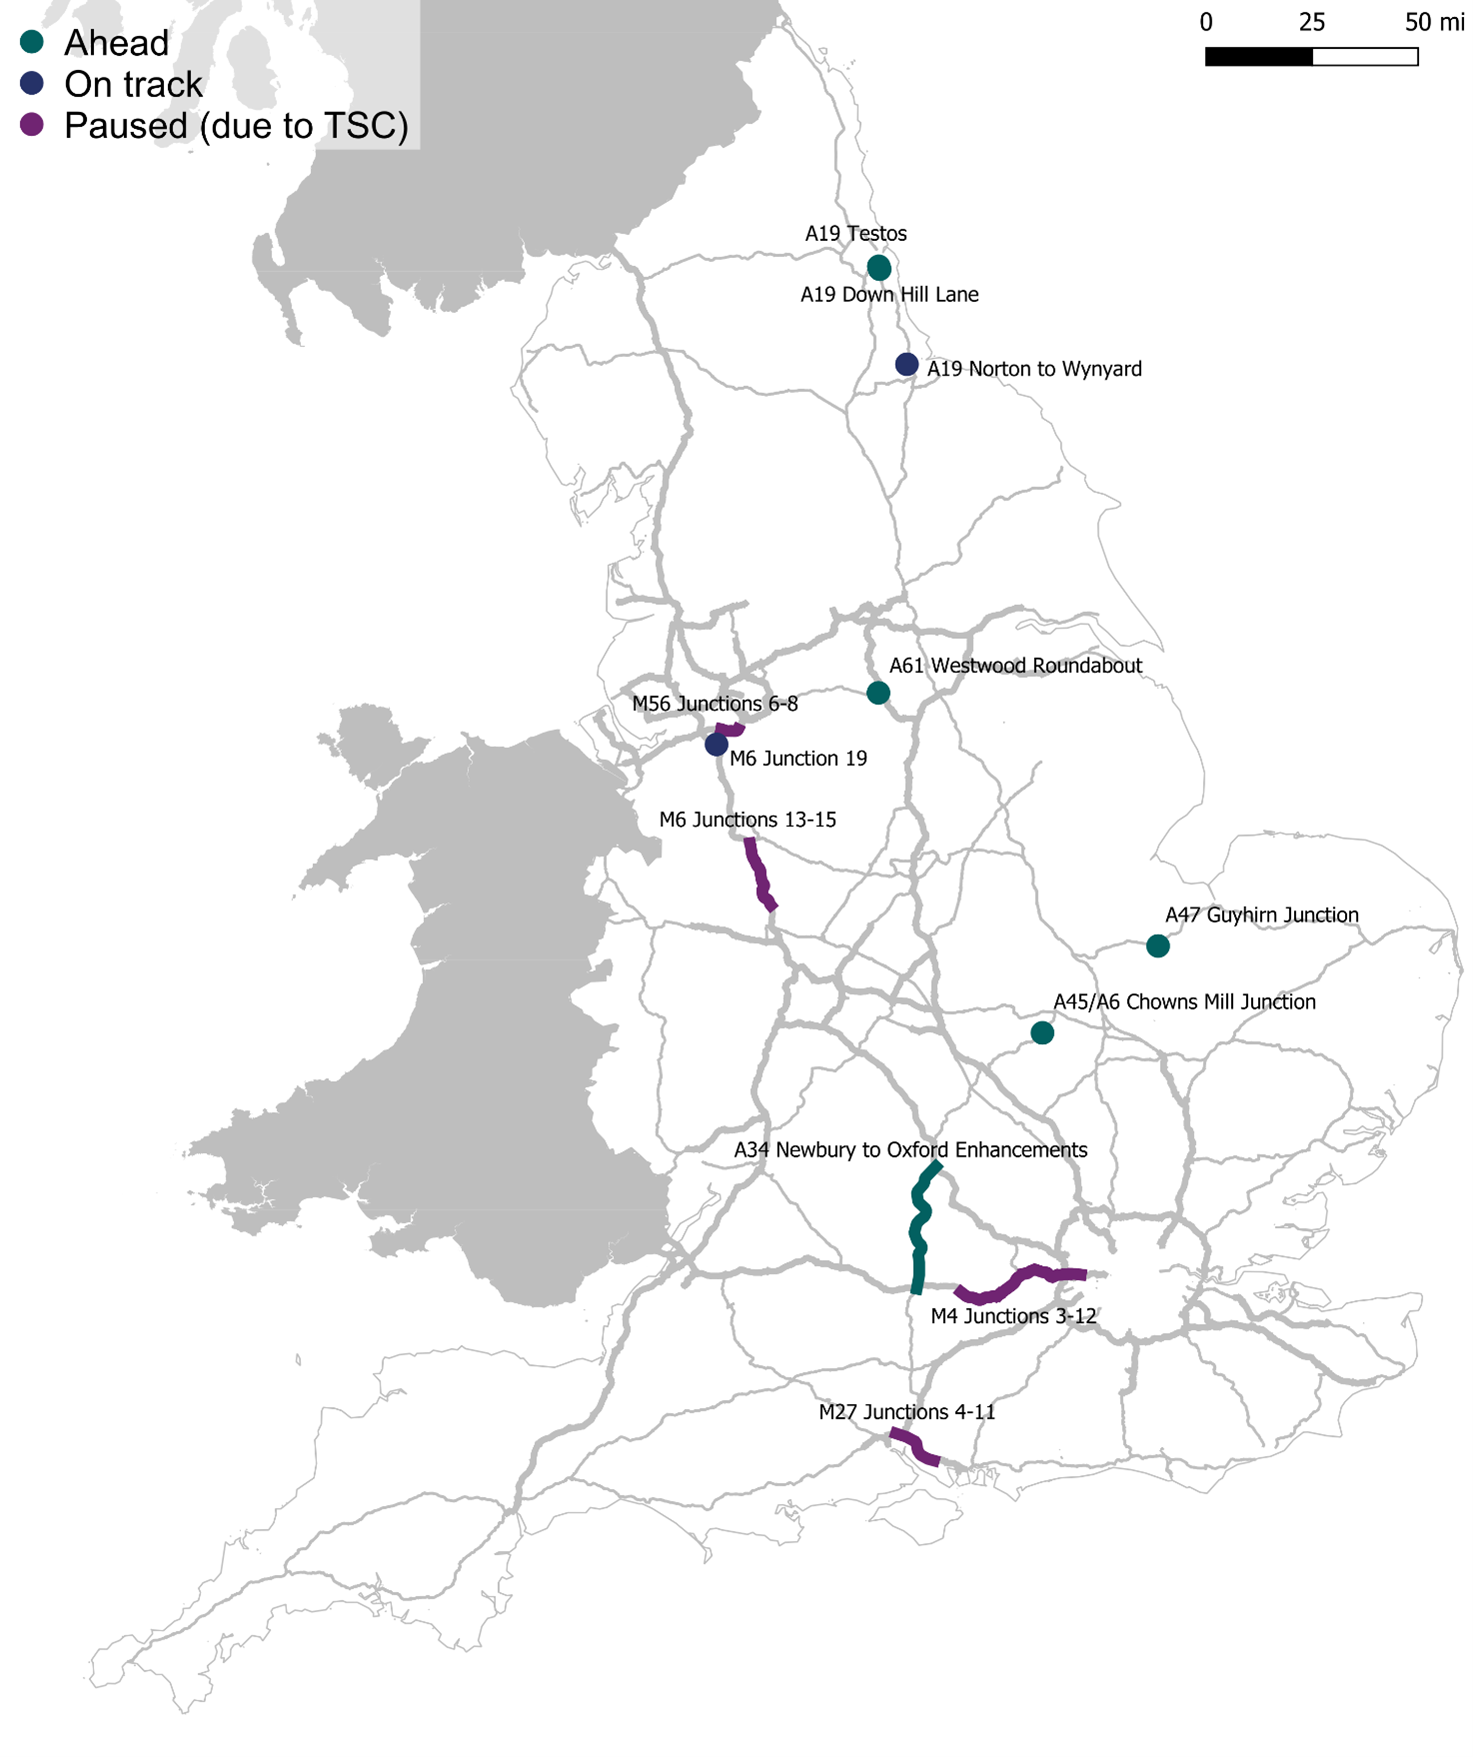
Enhancements portfolio complexity and change Collapse accordion Open accordion
B.7 National Highways faces challenges to its successful delivery of the RIS2 portfolio, including but not limited to:
- large and complex schemes valued at over £500m or that are novel or contentious (Tier 1), involving complex engineering design and/or detailed consultations with stakeholders; and
- Development Consent Order (DCO) planning applications for any scheme categorised as a Nationally Significant Infrastructure Project (NSIP);
- changes to the smart motorway programme; and
- additional enhancement scheme changes.
Tier 1 schemes
B.8 National Highways has a significantly larger Tier 1 programme for RP2 than it had for RP1. Table B.2 lists the Tier 1 schemes included in RIS2, alongside their RP2 SOW or OFT dates.
Table B.2 Tier 1 schemes committed to achieve SOW or OFT in RP2 at year-end 2021-22
| RIS2 scheme name | Committed SOW date | Committed OFT date |
|---|---|---|
| A66 Northern Trans-Pennine | 2024-25 | RP3 |
| A428 Black Cat to Caxton Gibbet | Q3 2022-23 | RP3 |
| A12 Chelmsford to A120 | 2023-24 | RP3 |
| Lower Thames Crossing | 2024-25 | RP3 |
| A303 Amesbury to Berwick Down (Stonehenge) | 2023-24 | RP3 |
| A358 Taunton to Southfields | 2024-25 | RP3 |
| A417 Air Balloon | Q2 2023-24 | RP3 |
| A14 Cambridge to Huntingdon | Pre-RP2 | Q1 2020-21(ahead of commitment) |
| M4 Junctions 3-12 | Pre-RP2 | Q2 2022-23* |
* government agreed to change OFT from Q4 2021-22 to allow for the installation of smart motorway technology
Planning
DCOs
B.9 National Highways requires DCOs for its large and significant enhancement schemes, classified as NSIPs (see paragraph 4.11). The Planning Inspectorate (PINS) makes recommendations to the Secretary of State (SofS), who then decides whether to grant consent.
B.10 Tables B.3 to B.5 below list all 33 RIS2 schemes that require a DCO, their status at time of publication where applicable (post DCO approval) and any agreed changes with government.
Table B.3 Schemes with an approved DCO
| Scheme | Status at time of publication | Government agreed change |
|---|---|---|
| A19 Testos | OFT Q2 2021-22 | - |
| A1 Birtley to Coal House | SOW Q1 2021-22 (early) | - |
| A19 Down Hill Lane | OFT Q4 2021-22 (early) | - |
| A63 Castle Street | SOW Q4 2019-20 | - |
| A585 Windy Harbour to Skippool | SOW Q4 2019-20 | - |
| M42 Junction 6 | SOW Q4 2019-20 | - |
| M54 to M6 link road | Pre-SOW | PINS recommendation Q2 2020-21 SofS approval Q4 2021-22 SOW moved Q4 2021-22 to Q4 2022-23 OFT moved Q4 2024-25 to RP3 |
| A14 Cambridge to Huntingdon | OFT Q1 2020-21 (early) | - |
| M4 Junctions 3-12 | SOW Q4 2016-17 | OFT moved Q4 2021-22 to Q2 2022-23 |
| M25 Junction 28 | Pre-SOW | PINS recommendation Q2 2021-22 SofS approval Q1 2022-23 SOW moved Q4 2021-22 to Q1 2023-24 |
| M25 Junction 10 | Pre-SOW | PINS recommendation Q2 2020-21 SofS approval Q1 2022-23 SOW moved Q2 2021-22 to Q3 2022-23 |
| A303 Sparkford to Ilchester | SOW Q4 2021-22 | PINS recommendation Q2 2019-20 SofS approval Q4 2020-21 SOW moved Q3 2020-21 to Q3 2021-22 |
| A30 Chiverton to Carland Cross | SOW Q4 2019-20 | - |
Table B.4 DCO applications submitted, not approved but yet to achieve SOW
| Scheme | Government agreed change |
|---|---|
| A1 Morpeth to Ellingham | PINS recommendation Q3 2021-22 |
| Mottram Moor Link Road & A57 Link Road | PINS recommendation due August 2022 |
| A38 Derby Junctions | PINS recommendation Q2 2020-21 Reviewed by SofS following judicial review |
| A47 Wansford to Sutton | PINS examination closes Q2 2022-23 |
| A47 North Tuddenham to Easton | PINS recommendation Q1 2022-23 |
| A47 Thickthorn Junction | PINS examination closed Q3 2021-22 |
| A47 Blofield to North Burlingham | PINS recommendation Q4 2021-22 |
| A428 Black Cat to Caxton Gibbet | PINS recommendation Q1 2022-23 |
| A303 Amesbury to Berwick Down (Stonehenge) | PINS recommendation Q4 2019-20 SofS approval Q3 2020-21 Judicial review judgement Q2 2021-22 Further information from National Highways due Q2 2022-23 SOW moved Q2 2022-23 to Q2 2024-25 |
| A417 Air Balloon | PINS recommendation due Q2 2022-23 SOW moved 2022-23 to 2023-24 OFT moved from 2024-25 to RP3 |
| A66 Northern Trans-Pennine | Application submitted Q1 2022-23 SOW moved 2024-25 to 2023-24 |
Table B.5 DCO application yet to be submitted
| Scheme | Government agreed change |
|---|---|
| A5036 Princess Way | Application to be submitted Q2 2022-23 |
| M60/M62/M66 Simister Island | Application to be submitted Q1 2022-23 |
| A46 Coventry Junctions | Binley Junction in construction (did not require DCO) Walsgrave Junction application to be submitted 2022-23 |
| A46 Newark Bypass | Application to be submitted Q2 2022-23 |
| A12 Chelmsford to A120 | Application to be submitted Q2 2022-23 |
| M3 Junction 9 | Application to be submitted Q1 2023-24 |
| A27 Arundel Bypass | Application to be submitted Q2 2022-23 SOW moved from 2023-24 to Q2 2024-25 |
| Lower Thames Crossing | First application withdrawn Q3 2020-21 Second application to be submitted Q3 2022-23 SOW moved from 2022-23 to 2024-25 |
| A358 Taunton to Southfields | Application to be submitted Q3 2022-23 SOW moved from 2023-24 to Q4 2024-25 |
B.11 During 2021-22 National Highways and DfT recognised the risks to SOW commitments if DCOs are not approved on schedule. They developed an action plan to help mitigate the risks at application stage. The actions included:
- National Highways’ forward look of estimated DCO timescales for PINS and local authority resource planning;
- joint resource planning with PINS to ensure application timescales align with its resources;
- lessons learned paper from schemes that have completed the DCO process;
- evidencing of cumulative carbon impacts;
- investigation of what more can be done at examination stage of the DCO process;
- investigation of what can be done to achieve acceptance of planning application by PINS;
- asking PINS if the company can apply for enhanced pre-application discussions and submissions to mitigate potential challenges at the application stage; and
- learning from DfT Transport Infrastructure Planning Unit debriefs.
Highways Act 1980
B.12 The Highways Act 1980 is used to gain approval for schemes that are not NSIPs, but which require alterations or additions within the highway boundary. This requires a different approach to consultation and approval. In 2021-22 there was a public inquiry into National Highways’ M27 Southampton Junction 8 scheme. We are awaiting the outcome.
Smart Motorways Programme (SMP)
B.13 The government’s response to the Transport Select Committee’s (TSC) November 2021 report had an impact on National Highways’ RP2 enhancements programme delivery in 2021-22. Table B.6 sets out the changes that government agreed to the SMP.
Table B.6 SMP at year-end 2021-22
| Scheme name | Current phase | Government agreed changes |
|---|---|---|
| M56 Junctions 6-8 | Construction | OFT moved Q4 2021-22 to Q2 2022-23 To incorporate SVD |
| M6 Junctions 13-15 | Construction | OFT moved Q4 2021-22 to Q2 2022-23 To incorporate SVD |
| M4 Junctions 3-12 | Construction | OFT moved Q4 2021-22 to Q2 2022-23 To incorporate SVD |
| M27 Junctions 4-11 | OFT Q1 2022-23 | OFT moved Q4 2021-22 to Q1 2022-23 To carry out safety assessments of SVD |
| M6 Junctions 21A-26 | Construction/OFT Q4 2022-23 | No change |
| M1 Junctions 13-19 | Construction/OFT Q4 2022-23 | No change |
| M40/M42 interchange | Construction | OFT paused |
| M3 Junctions 9-14 | Construction | OFT paused |
| M62 Junctions 25 to 30 upgrade DHS to all lane running | Development | SOW moved 2021-22 to RP3 |
| M6 Junctions 4-5 upgrade DHS running to all lane running | Development | SOW moved 2021-22 to RP3 |
| M62 J20-25 | Development | SOW moved 2022-23 to RP3 |
| M6 Junction 5-8 upgrade DHS running to all lane running | Development | SOW moved 2022-23 to RP3 |
| M6 Junctions 8-10a upgrade DHS running to all lane running | Development | SOW moved 2022-23 to RP3 |
| M1 J10 to 13 retrofit upgrade DHS running to all lane running | Development | SOW moved 2022-23 to RP3 |
| M4 J19-20 & M5 J16-17 upgrade DHS running to all lane running | Development | SOW moved 2022-23 to RP3 |
| M42 Junctions 4-7 upgrade dynamic DHS to all lane running | Development | SOW moved 2023-24 to RP3 |
| M25 Junctions 10–16 | Development | Scheme paused |
Additional enhancement scheme changes
B.14 Table B.7 shows additional schemes that government and National Highways agreed to change in 2021-22.
Table B.7 Additional schemes with agreed schedule changes
| Scheme | Government agreed change |
|---|---|
| A5 Dodwells to Longshoot | Cancelled for delivery in RP2 and removed as a RIS2 commitment |
| A21 Safety Package | SOW moved RP3 to Q1 2021-22 |
| M2 Junction 5 | SOW moved 2020-21 to Q2 2021-22; COVID-19 pandemic delays to planning process |
| M27 Southampton Junction 8 | SOW moved Q2 2021-22 to Q3 2023-24; public inquiry May 2022. OFT moved 2022-23 to Q2 2024-25 |
| M621 Junctions 1-7 | OFT moved 2022-23 to Q2 2024-25; design changes associated with local highway authority works |
Status of RIS2 enhancement portfolio at year-end 2021-22 Collapse accordion Open accordion
B.15 Throughout the first two years of RP2 National Highways and government agreed changes to the company’s 2020-2025 delivery plan and 2021-22 delivery plan. These changes are reflected in the number of schemes that achieved SOW and were OFT. Tables B.8 and B.9 set out the regional position at year-end 2021-22.
Table B.8 SOW status of schemes by National Highways’ regions
B.8a - Position at start of RP2
| Region | Started prior to RP2 | SOW forecast at start of RP2 |
|---|---|---|
| North-East | 6 | 4 |
| North-West | 3 | 6 |
| Midlands | 9 | 8 |
| East | 1 | 9 |
| South-East | 6 | 11 |
| South-West | 1 | 5 |
B.8b - Position at end of 2021-22
| Region | Started in RP2 | SOW in remainder of RP2 | Deferred to RP3 | Paused or stopped |
|---|---|---|---|---|
| North-East | 2 | 1 | 0 | 1 |
| North-West | 1 | 3 | 1 | 1 |
| Midlands | 0 | 2 | 1 | 4* |
| East | 1 | 7 | 0 | 1 |
| South-East | 4 | 7 | 0 | 1** |
| South-West | 1 | 3 | 0 | 1 |
* Excludes M40/M42 – SOW; paused due to TSC
** Excludes M3 J9-14 – SOW; paused due to TSC
Table B.9 OFT status of schemes by National Highways’ regions
B.9a - Position at start of RP2
| Region | OFT beyond RP2 | OFT forecast at start of RP2 |
|---|---|---|
| North-East | 0 | 10 |
| North-West | 5 | 4 |
| Midlands | 3 | 14 |
| East | 2 | 8 |
| South-East | 5 | 12 |
| South-West | 2 | 4 |
B.9b - Position at end of 2021-22
| Region | OFT | In construction | Deferred to RP3 | Paused or stopped |
|---|---|---|---|---|
| North-East | 4 | 4 | 0 | 1 |
| North-West | 1 | 3 | 0 | 1 |
| Midlands | 2 | 7 | 2 | 6 |
| East | 2 | 0 | 0 | 1 |
| South-East | 1 | 9* | 3 | 2 |
| South-West | 0 | 2 | 1 | 1 |
* One additional scheme in construction
Enhancements programme delivery
B.16 National Highways delivers its enhancements schemes under four programmes:
- Complex Infrastructure Programme (CIP);
- Smart Motorways Programme (SMP);
- Regional Investment Programme (RIP); and
- Operations Directorate (OD).
- The programme structure groups enhancement schemes by commonalities, such as type and complexity, and allows us to identify shared trends that can impact a specific group of schemes.
B.17 Figure B.4 shows how government agreed changes are distributed across all programmes.
Figure B.4 Reasons for schedule changes by programme at year-end 2021-22
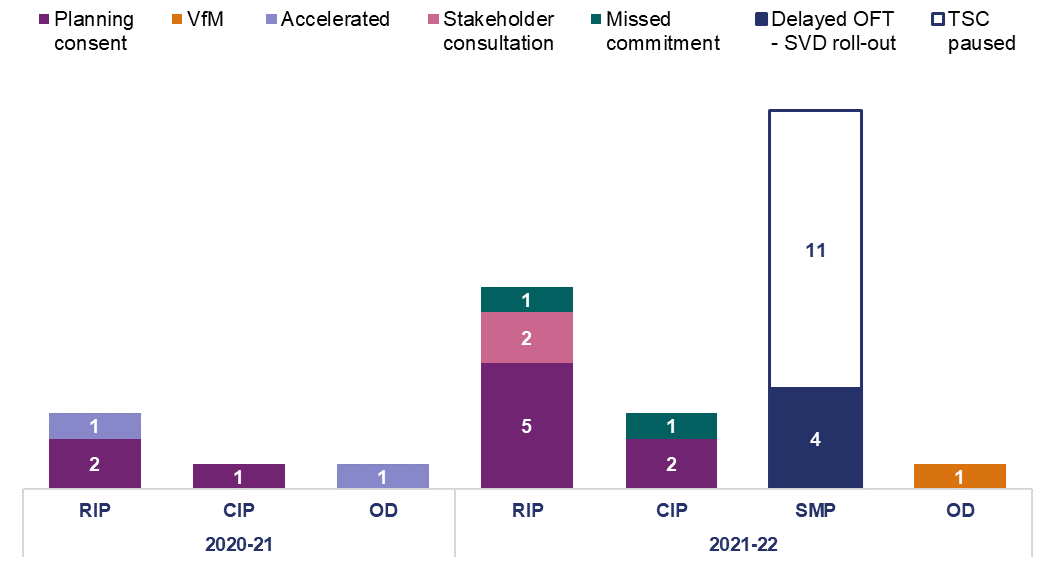
B.18 Figures B.5 and B.6 show the impact of the agreed schedule changes on delivery plan commitments by programme for the remainder of RP2.
Figure B.5 Schedule changes to SOW commitments by delivery programme at year-end 2021-22
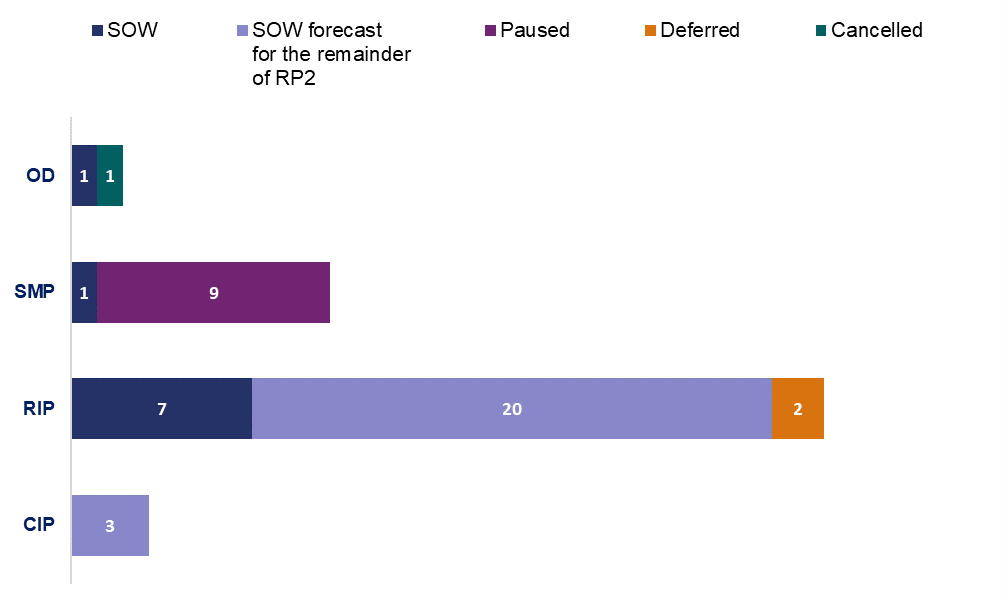
Figure B.6 Schedule changes to OFT commitments by programme at year-end 2021-22
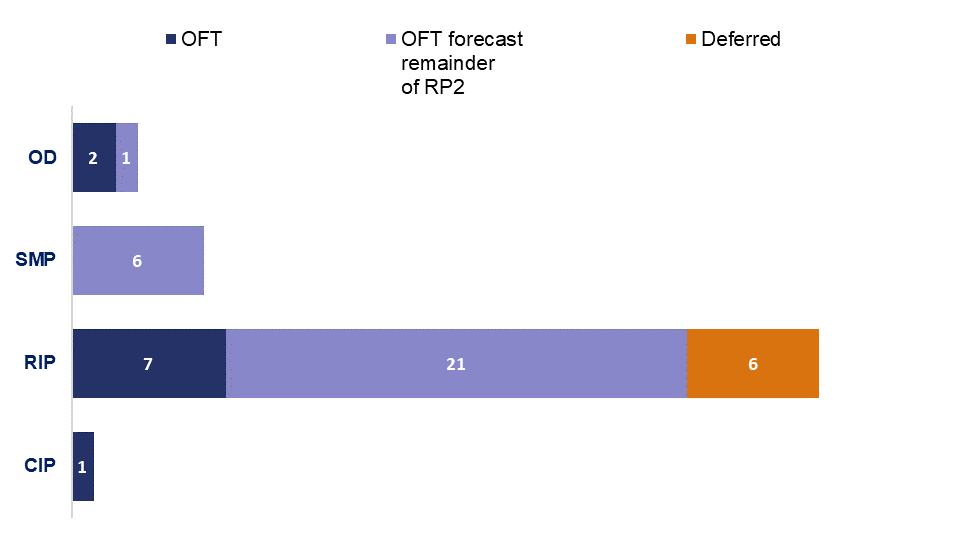
B.19 Figure B.7 shows more scheme commitments at risk across all programmes at year-end 2021-22 compared to year-end 2020-21. The biggest change is across SMP.
Figure B.7 Programme commitments at risk and on schedule between 2020-21 and 2021-22
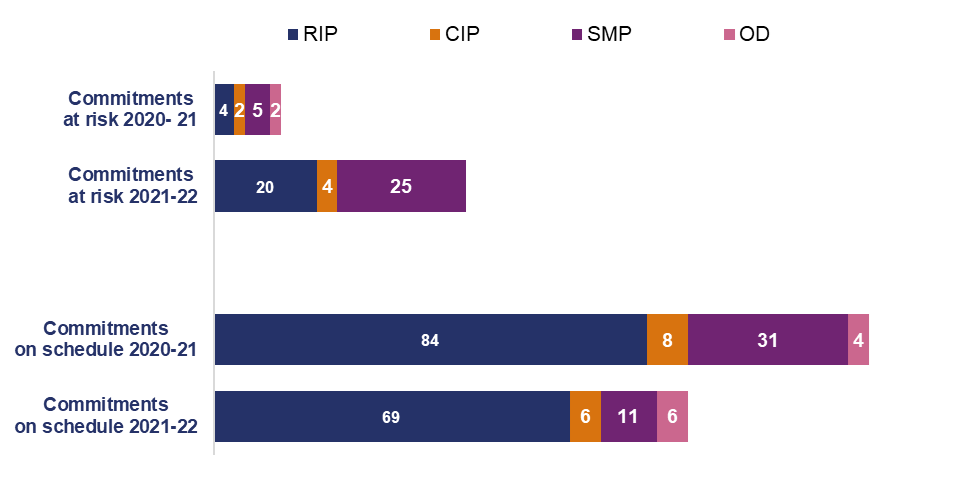
Scheme status and risk to delivery commitment being met
B.20 Figures B.8 to B.13 map scheme locations for National Highways’ regions. Tables B.10 to B.15 support each regional map. The tables show the status of each scheme, including the company’s reported risk of achieving SOW or OFT commitments.
Figure B.8 North-East schemes at year-end 2021-22
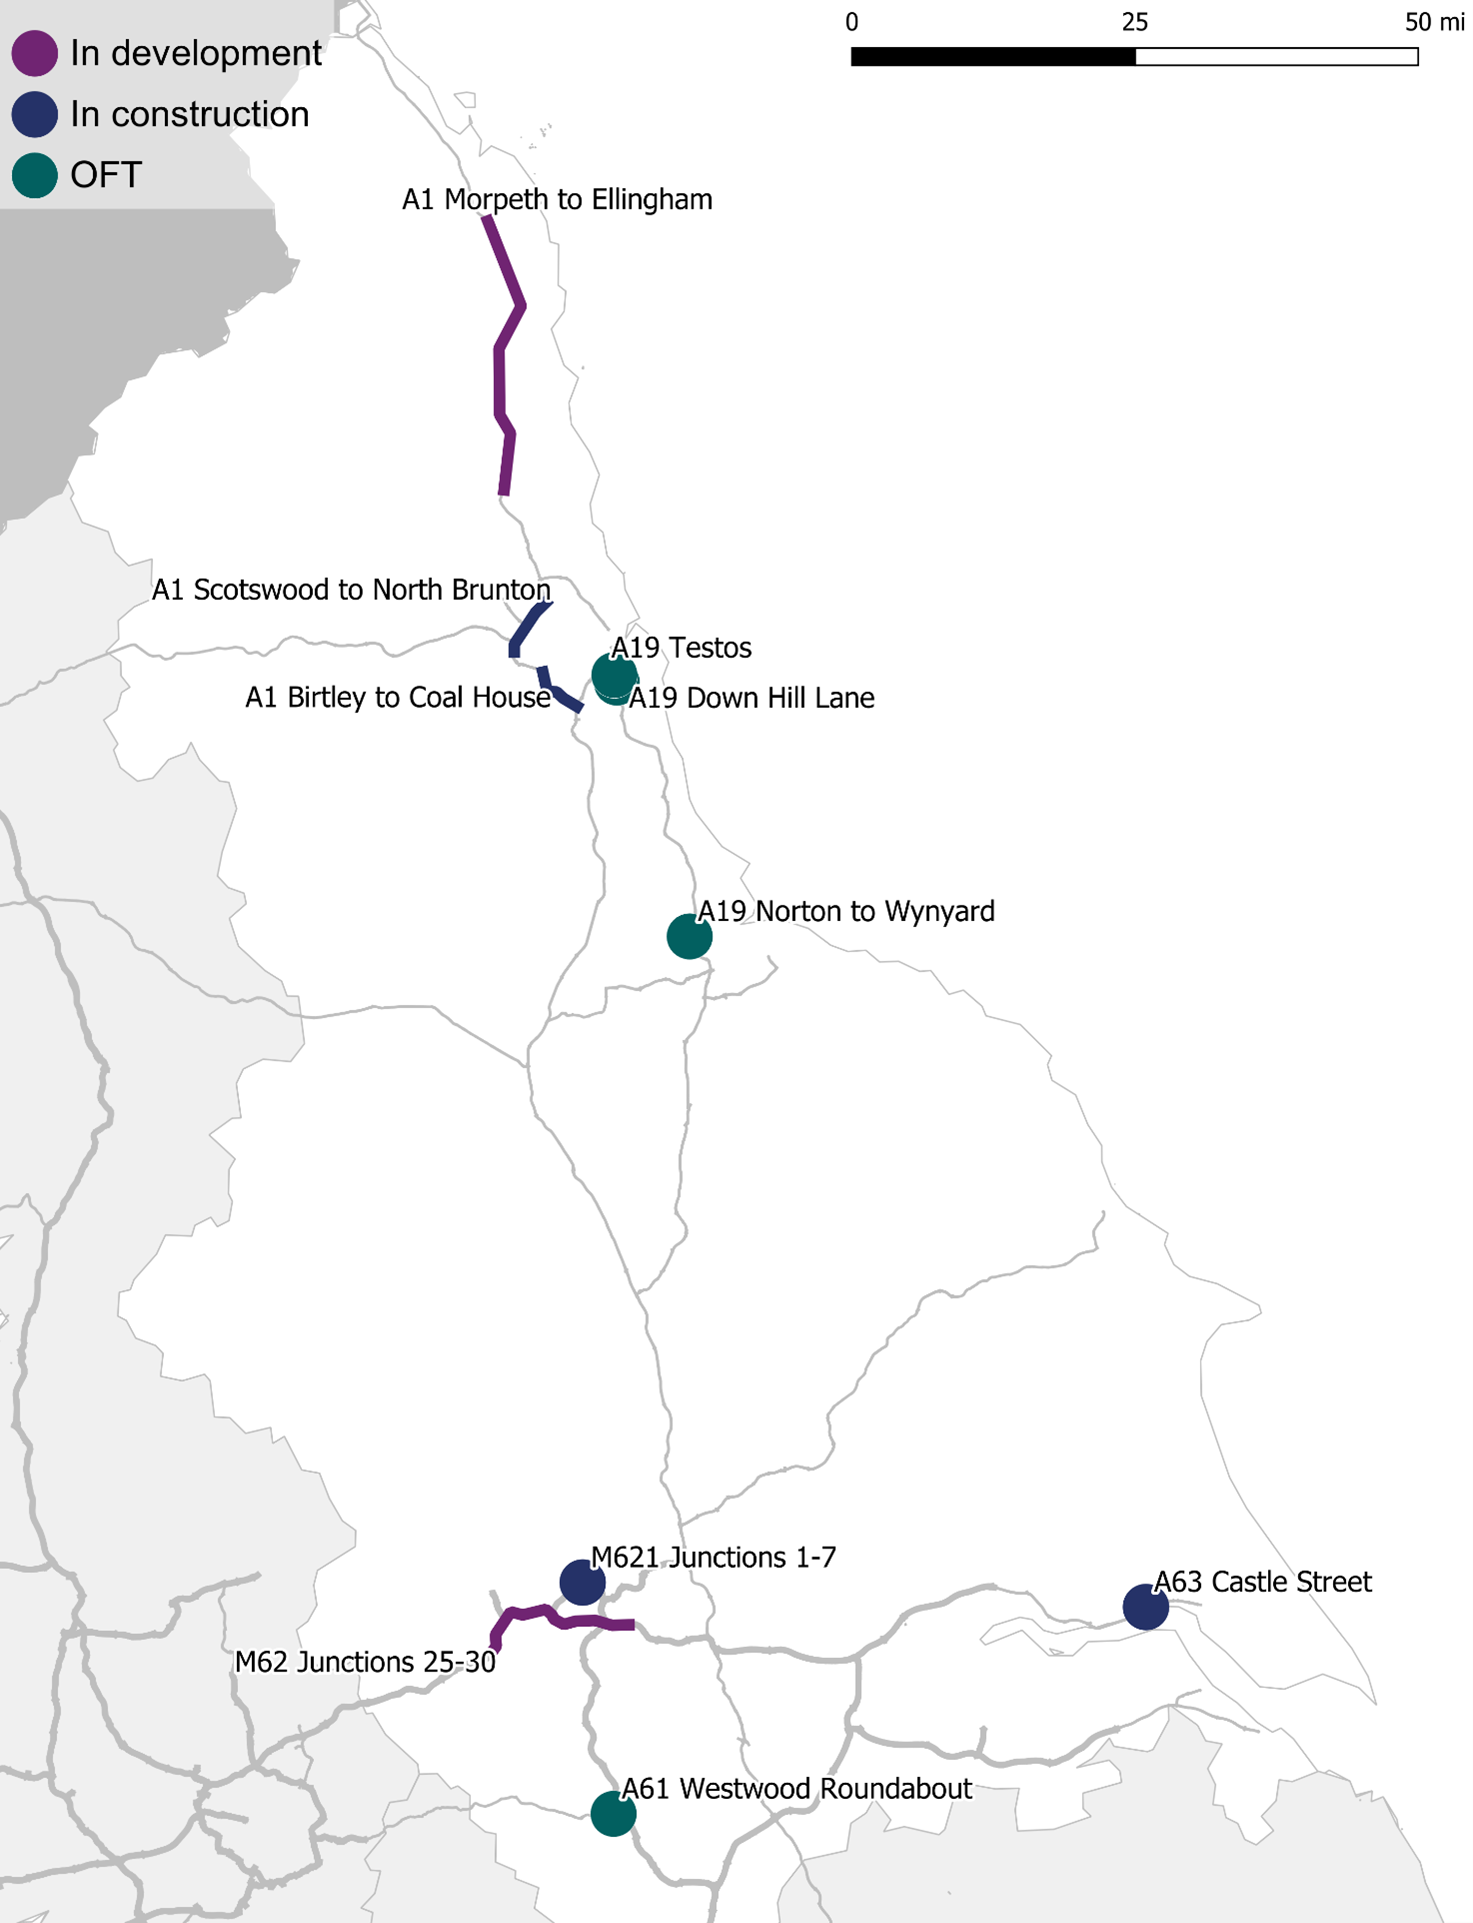
Table B.10 Status of North-East scheme delivery at year-end 2021-22
| RIS2 number (programme) | Scheme name | SOW commitment | OFT commitment |
|---|---|---|---|
| 1 (RIP) | A1 Scotswood to North Brunton | Completed | On target |
| 2 (RIP) | A19 Testos | Completed | Completed |
| 3 (RIP) | A19 Norton to Wynyard | Completed | Completed |
| 4 (RIP) | M621 Junctions 1-7 | Completed | At risk of missing commitment |
| 5 (RIP) | A61 Westwood Roundabout | Completed | Completed |
| 6 (RIP) | A1 Morpeth to Ellingham | At risk of missing commitment | At risk of missing commitment |
| 7 (RIP) | A1 Birtley to Coal House | Completed | On target |
| 8 (RIP) | A19 Down Hill Lane | Completed | Completed |
| 9 (RIP) | A63 Castle Street | Completed | On target |
| 10 (SMP) | M62 junctions 25 to 30 upgrade DHS running to all lane running | Paused (TSC) | Paused (TSC) |
Figure B.9 North-West schemes at year-end 2021-22
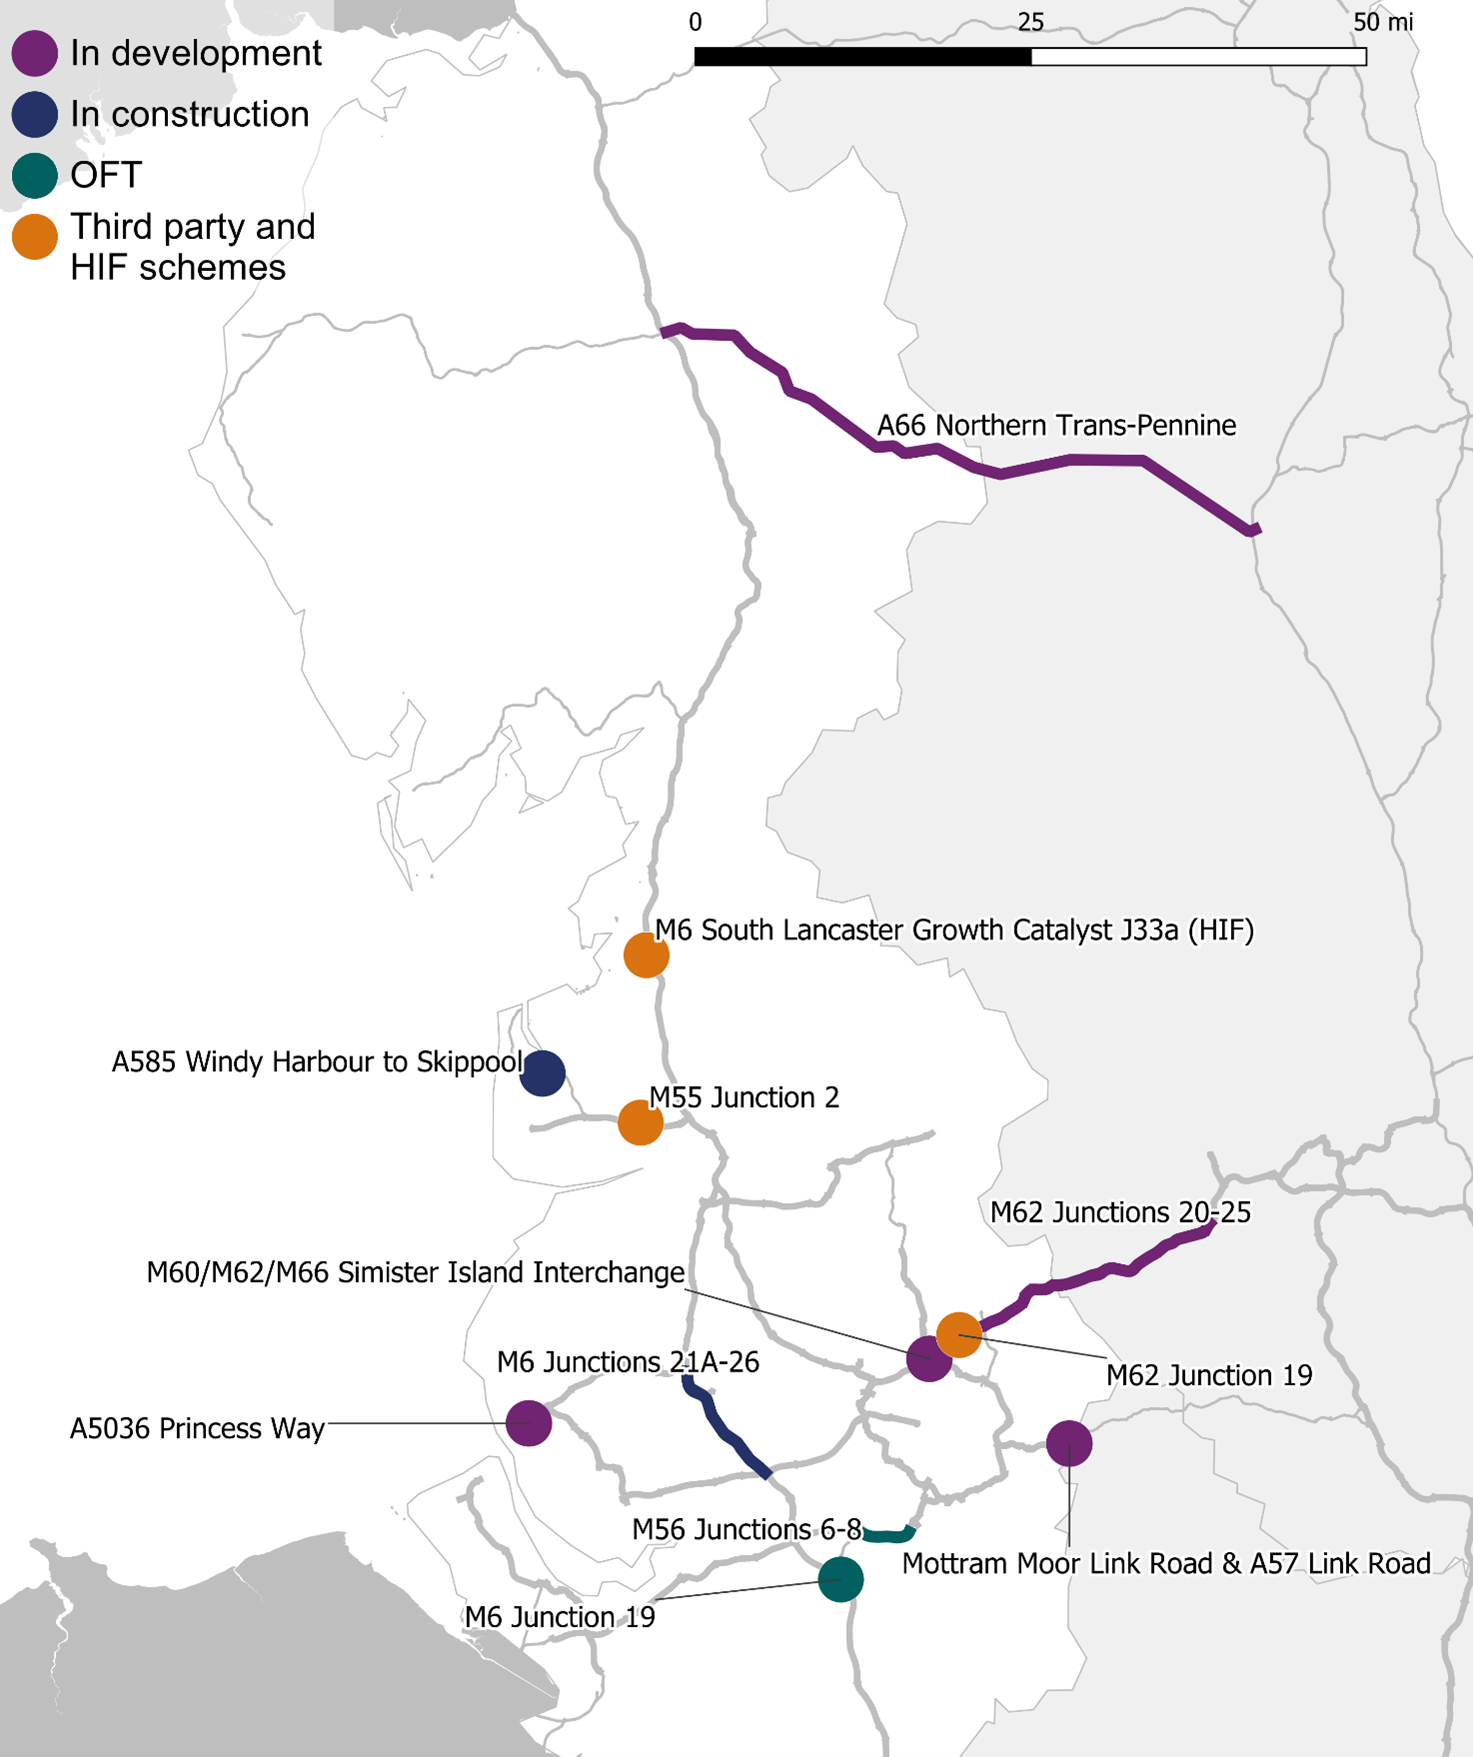
Table B.11 Status of North-West scheme delivery at year-end 2021-22
| RIS2 number (programme) | Scheme name | SOW commitment | OFT commitment |
|---|---|---|---|
| 11 (RIP) | A585 Windy Harbour to Skippool | Completed | On target |
| 12 (SMP) | M62 Junctions 20-25 | Paused (TSC) | Paused (TSC) |
| 13 (RIP) | M6 Junction 19 | Completed | Completed |
| 14 (RIP) | A66 Northern Trans-Pennine | On target | On target |
| 15 (RIP) | A5036 Princess Way | At risk of missing commitment | On target |
| 16 (SMP) | M6 Junctions 21A-26 | Completed | At risk of missing commitment |
| 17 (RIP) | Mottram Moor Link Road & A57 Link Road | At risk of missing commitment | On target |
| 18 (SMP) | M56 Junctions 6-8 | Completed | At risk of missing commitment |
| 19 (RIP) | M60/M62/M66 Simister Island | On target | On target |
Figure B.10 Midlands schemes at year-end 2021-22
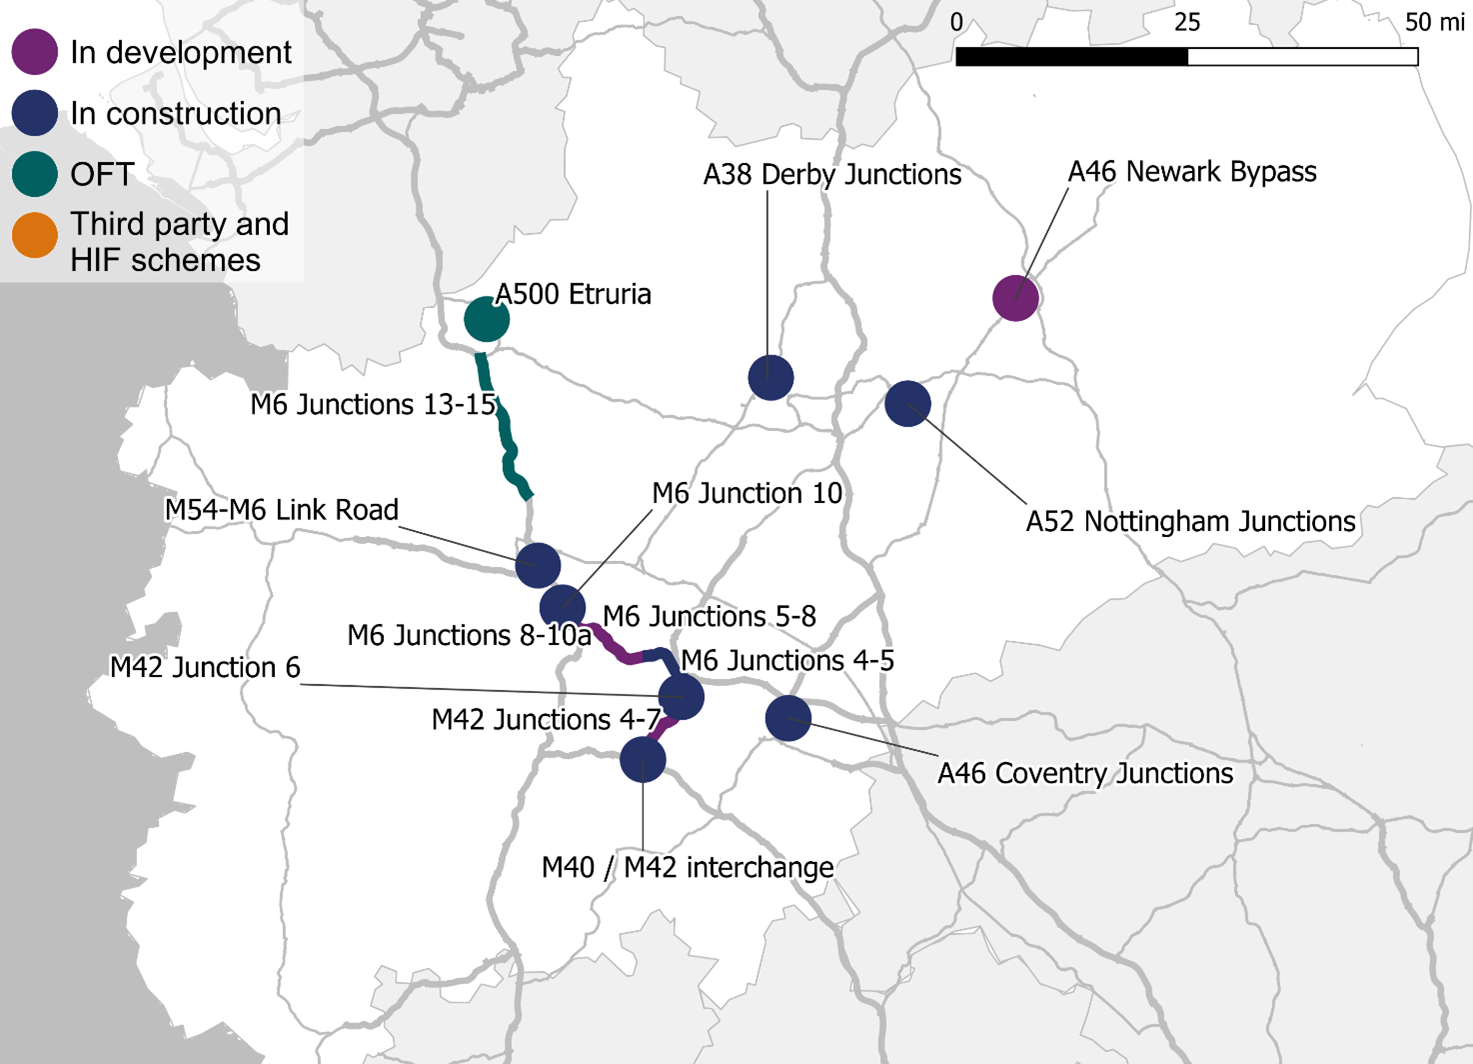
Table B.12 Status of Midlands scheme delivery at year-end 2021-22
| RIS2 number (Programme) | Scheme name | SOW commitment | OFT commitment |
|---|---|---|---|
| 20 (RIP) | A500 Etruria | Completed | Completed |
| 21 (SMP) | M6 Junctions 13-15 | Completed | At risk of missing commitment |
| 22 (RIP) | M42 Junction 6 | Completed | On target |
| 23 (RIP) | A46 Coventry Junctions | Completed | On target |
| 24 (SMP) | M40/M42 interchange | Completed | Completed |
| 27 (RIP) | A38 Derby Junctions | At risk of missing commitment | At risk of missing commitment |
| 28 (RIP) | M54-M6 Link Road | At risk of missing commitment | At risk of missing commitment |
| 29 (OD) | A5 Dodwells to Longshoot | Cancelled | Cancelled |
| 30 (RIP) | A52 Nottingham Junctions | Completed | At risk of missing commitment |
| 31 (RIP) | M6 Junction 10 | Completed | On target |
| 32 (RIP) | A46 Newark Bypass | At risk of missing commitment | On target |
| 33 (SMP) | M42 junctions 4 to 7 upgrade DHS running to all lane running | Paused (TSC) | Paused (TSC) |
| 34 (SMP) | M6 junctions 4 to 5 upgrade DHS running to all lane running | Paused (TSC) | Paused (TSC) |
| 35 (SMP) | M6 junction 5 to 8 upgrade DHS running to all lane running | Paused (TSC) | Paused (TSC) |
| 36 (SMP) | M6 junctions 8 to 10a upgrade DHS running to all lane running | Paused (TSC) | Paused (TSC) |
Figure B.11 East schemes at year-end 2021-22
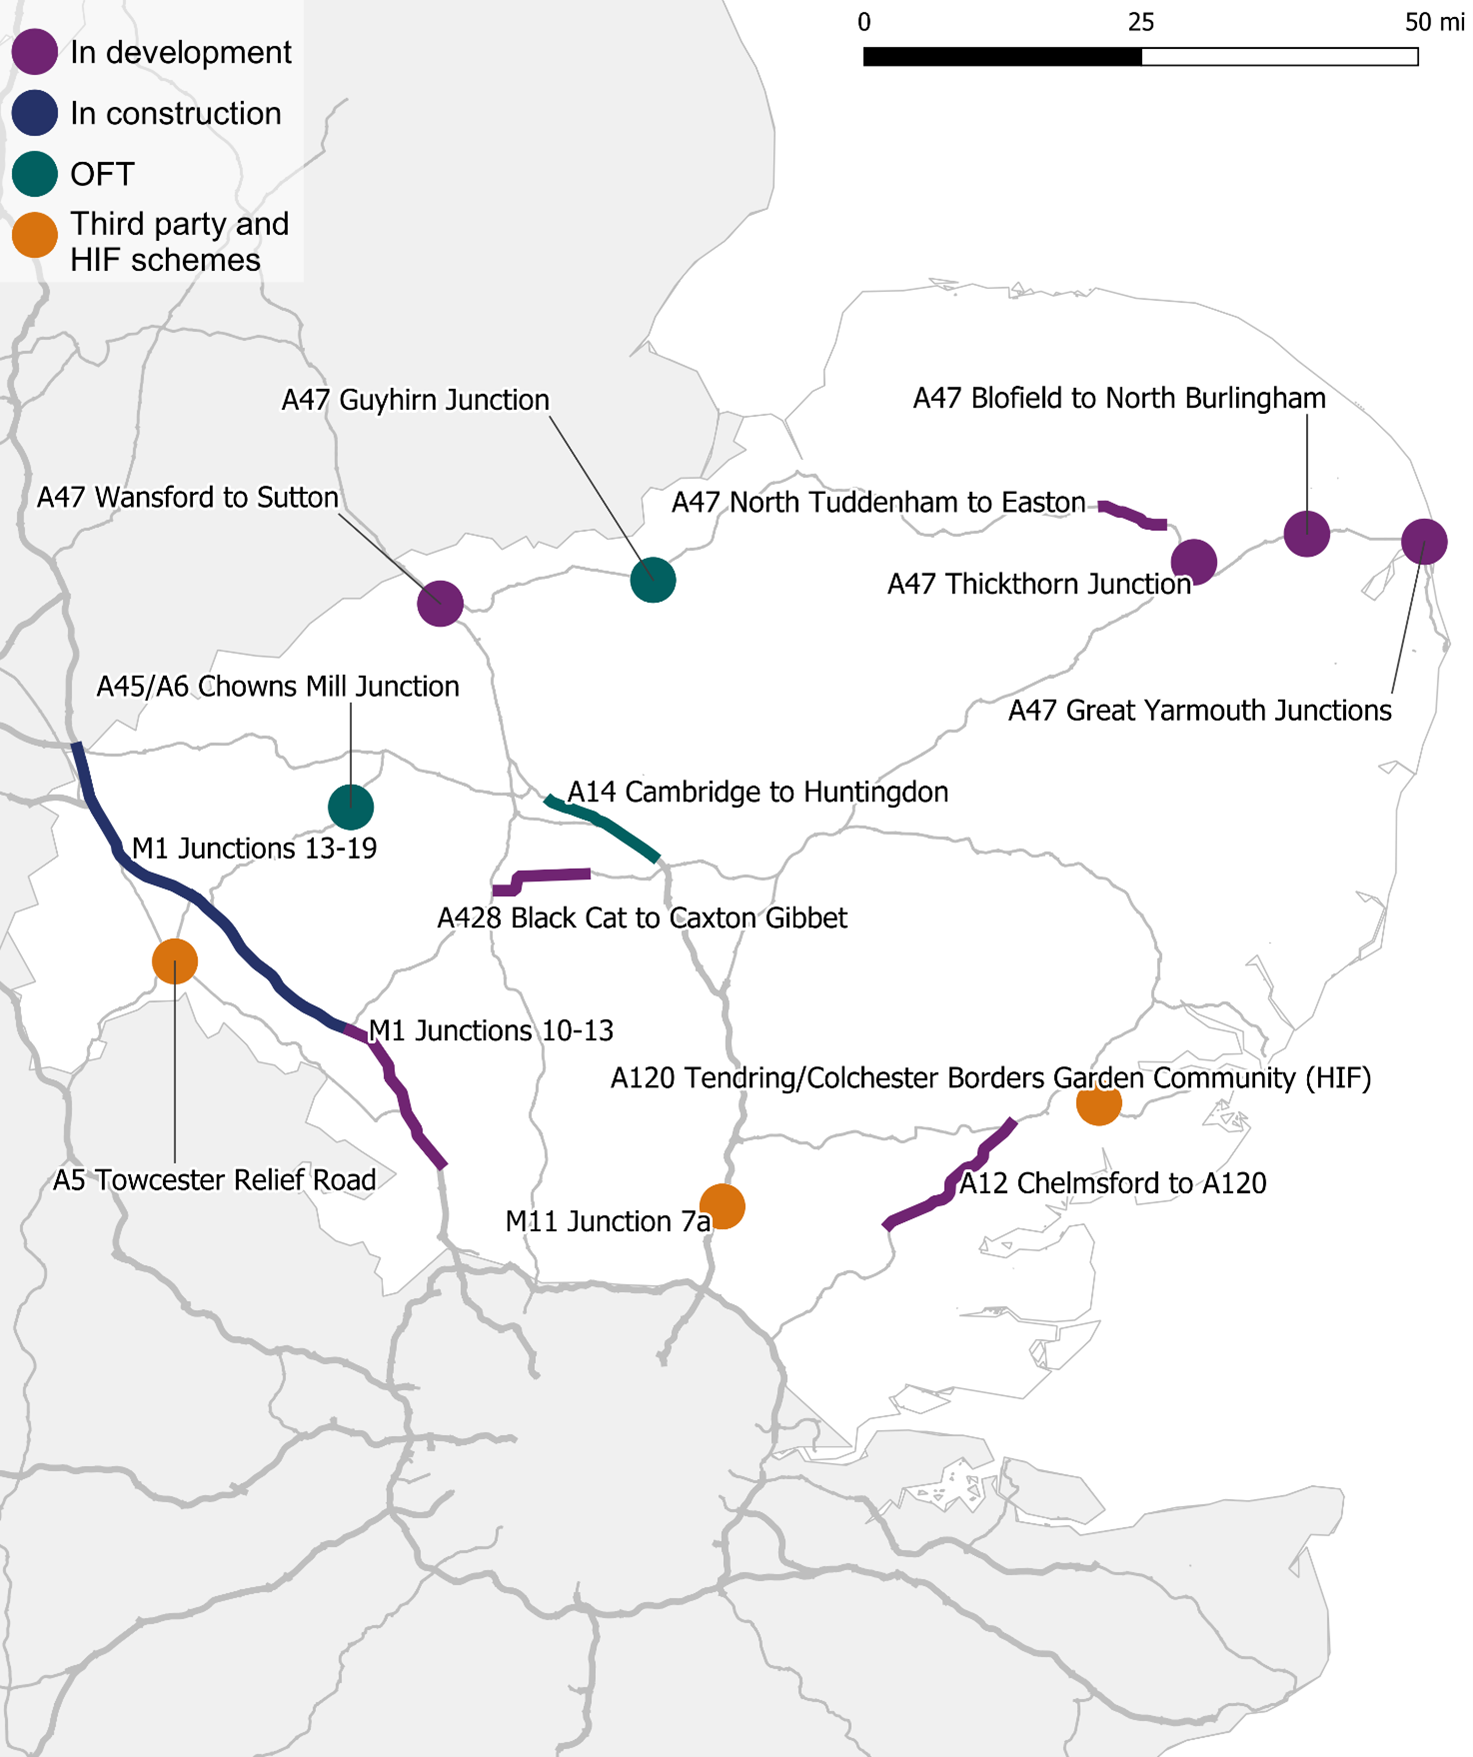
Table B.13 Status of East scheme delivery at year-end 2021-22
| RIS2 number (Programme) | Scheme name | SOW commitment | OFT commitment |
|---|---|---|---|
| 25 (OD)* | A45/A6 Chowns Mill Junction | Completed | Completed |
| 26 (SMP)* | M1 Junctions 13-19 | Completed | On target |
| 37 (CIP) | A14 Cambridge to Huntingdon | Completed | Completed |
| 38 (RIP) | A47 Wansford to Sutton | On target | On target |
| 39 (RIP) | A47 Great Yarmouth Junctions | On target | On target |
| 40 (RIP) | A47 Guyhirn Junction | Completed | Completed |
| 41 (RIP) | A47 North Tuddenham to Easton | On target | On target |
| 42 (RIP) | A47 Thickthorn Junction | On target | On target |
| 43 (RIP) | A47 Blofield to North Burlingham | On target | On target |
| 44 (CIP) | A428 Black Cat to Caxton Gibbet | Missed commitment | On target |
| 45 (CIP) | A12 Chelmsford to A120 | Scheme at risk of missed commitment | On target |
| 46 (SMP) | M1 junctions 10 to 13 retrofit upgrade DHS running to all lane running | Paused (TSC) | Paused (TSC) |
*Schemes included in East region in RIS2
Figure B.12 South-East schemes at year-end 2021
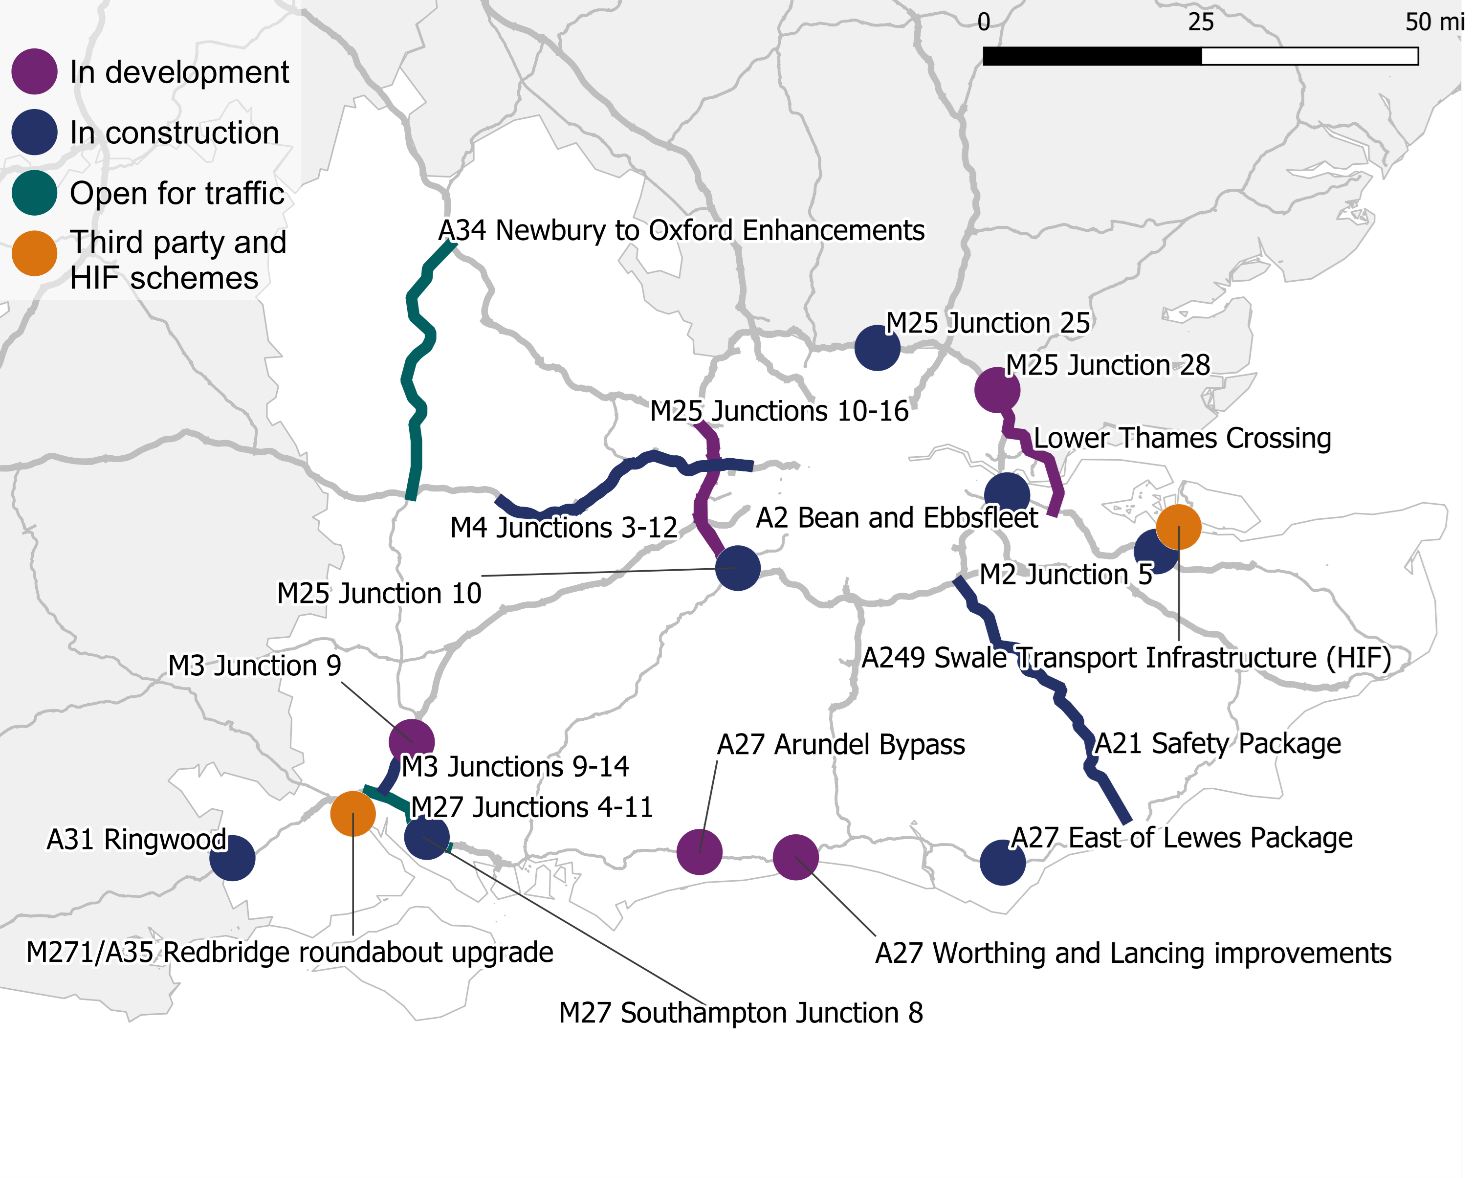
Table B.14 Status of South-East scheme delivery at year-end 2021-22
| RIS2 number (Programme) | Scheme name | SOW commitment | OFT commitment |
|---|---|---|---|
| 47 (SMP) | M4 Junctions 3-12 | Completed | At risk of missing commitment |
| 48 (OD) | A34 Newbury to Oxford Enhancements | Completed | Completed |
| 49 (SMP) | M3 Junctions 9-14 | Completed | Paused (TSC) |
| 50 (SMP) | M27 Junctions 4-11 | Completed | At risk of missing commitment |
| 51 (RIP) | M25 Junction 25 | Completed | On target |
| 52 (RIP) | M25 Junction 28 | At risk of missing commitment | At risk of missing commitment |
| 53 (SMP) | M25 Junctions 10–16 | Paused (TSC) | Paused (TSC) |
| 54 (RIP) | M25 Junction 10 | At risk of missing commitment | At risk of missing commitment |
| 55 (RIP) | M3 Junction 9 | On target | On target |
| 56 (RIP) | M27 Junction 8 | At risk of missing commitment | At risk of missing commitment |
| 57 (RIP) | A27 Arundel Bypass | At risk of missing commitment | On target |
| 58 (RIP) | A27 Worthing and Lancing Improvements | On target | On target |
| 59 (RIP) | A31 Ringwood | Completed | On target |
| 60 (RIP) | A2 Bean and Ebbsfleet | Completed | On target |
| 61 (RIP) | M2 Junction 5 | Completed | On target |
| 62 (RIP) | A27 East of Lewes Package | Completed | On target |
| 63 (CIP) | Lower Thames Crossing | At risk of missing commitment | On target |
| 70 (OD) | A21 Safety Package | Completed | On target |
| RP1 Scheme | M271/A35 Redbridge roundabout upgrade | Completed | Completed |
Figure B.13 Map of South-West scheme location and status
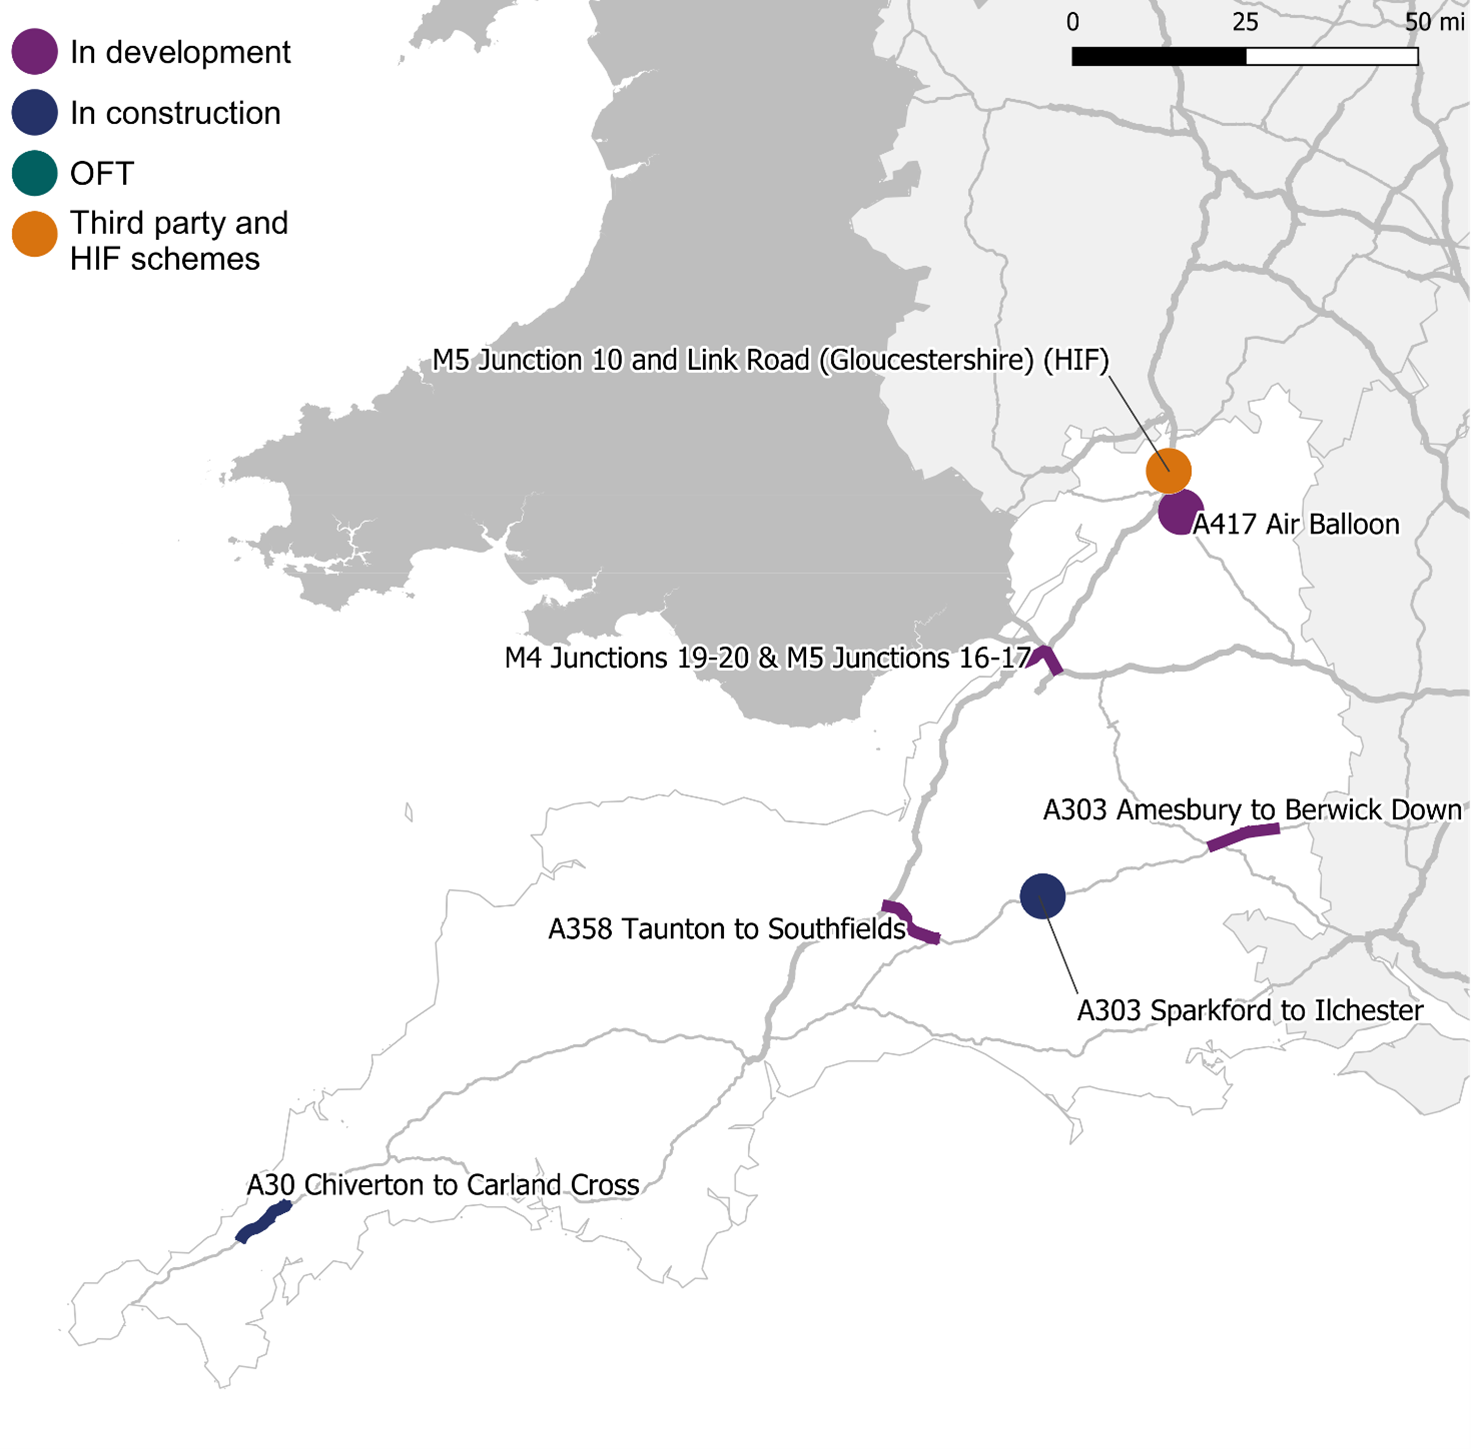
Table B.15 Status of South-West schemes at year-end 2021-22
| Programme | Scheme name | SOW commitment | OFT commitment |
|---|---|---|---|
| 64 (RIP) | A303 Sparkford to Ilchester | Completed | On target |
| 65 (CIP) | A303 Amesbury to Berwick Down (Stonehenge) | At risk of missing commitment | On target |
| 66 (RIP) | A358 Taunton to Southfields | On target | On target |
| 67 (RIP) | A30 Chiverton to Carland Cross | On target | On target |
| 68 (RIP) | A417 Air Balloon | Missed commitment | On target |
| 69 (SMP) | M4 junctions 19 to 20 and M5 junctions 16 to 17 upgrade DHS running to all lane running | Paused (TSC) | Paused (TSC) |
Post opening project evaluations (POPEs) Collapse accordion Open accordion
B.21 POPEs are a standardised method of assessment for enhancements schemes developed by National Highways. A POPE evaluates the actual impact of a scheme compared to expected impacts once the scheme is OFT. The company currently evaluates each scheme at the one- and five-year milestones after OFT.
B.22 At year-end 2021-22, National Highways had 24 RIS1 and RIS2 schemes within its POPE programme. Figure B.14 shows the number of schemes that have passed the relevant milestone for a POPE and if each scheme originated from RIS1 or RIS2.
Figure B.14 Number of RIS1 and RIS2 schemes programmed for POPEs
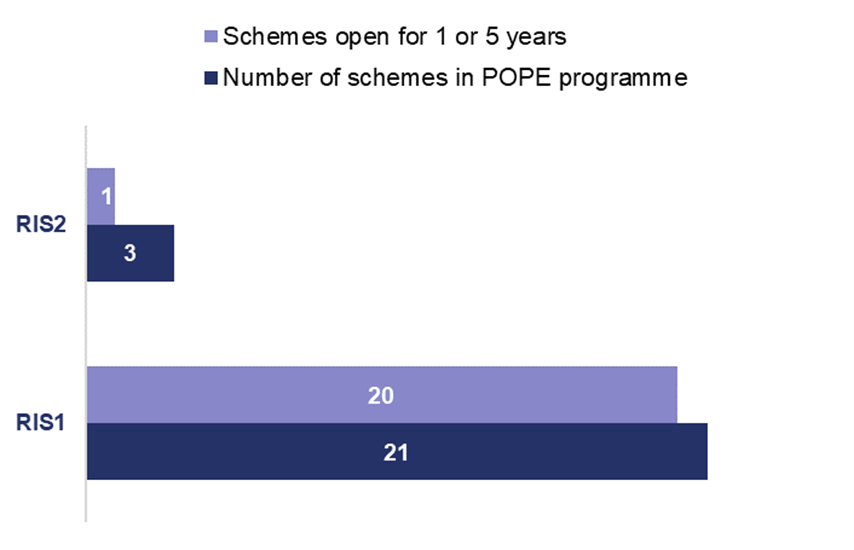
B.23 National Highways reported that the impact of the coronavirus (COVID-19) pandemic on traffic levels had compromised its ability to collect data and support a more robust assessment of scheme benefits. In February 2022, the company confirmed that it would move nine POPEs from a one-year to a three-year evaluation process. Five-year POPEs were not affected. We agreed that the company had made a reasonable assessment of the impact of COVID-19, and that it had made appropriate changes to its POPE process.
B.24 National Highways is also considering a permanent move to a three-year evaluation process to replace the current one- and five-year process. The company has told us that three-year POPEs would provide a more rigorous analysis of scheme impacts, based on more traffic and safety data and a longer interval to allow environmental mitigations to bed-in. Although early observations are useful, there are limitations to the level of data available one year after opening. We will increase our scrutiny in this area in 2022-23.
Publication programme for POPEs
B.25 National Highways published five POPEs in 2021-22. One POPE was for a RIS1 scheme, the other four were for pre-RP1 schemes. Figure B.15 shows the status of one-year POPEs for RIS1 and RIS2 schemes.
Figure B.15 Status of one-year POPEs: RIS1 and RIS2 schemes at year-end 2021-22
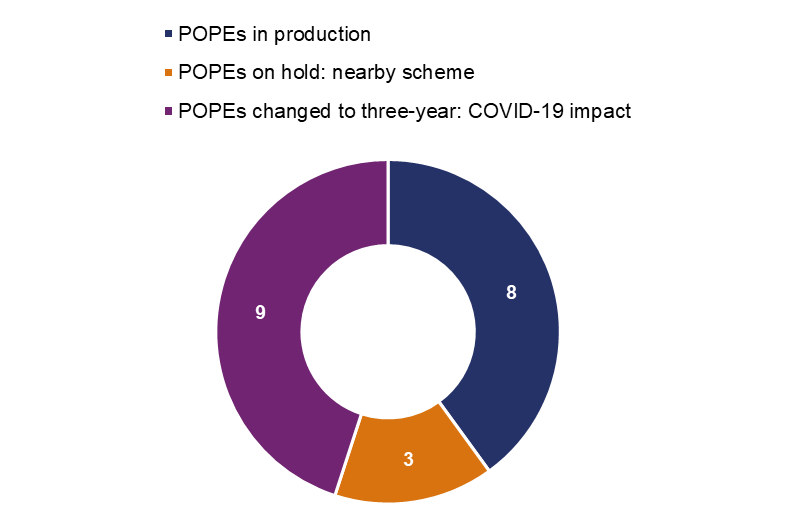
B.26 In 2020, we published a review of how National Highways evaluates its enhancements schemes. It found that the average time between a scheme being OFT and publication of the relevant POPE report, was 27 months. The company took POPE production in-house in 2017 and took responsibility for publication in 2018. As a result of these changes, the review said that we could expect to see a significant improvement in the time taken to publish future POPE reports.
B.27 National Highways has an ambitious POPE publication programme for 2022-23. It is planning to publish 28 POPEs. Of these, 21 are for outstanding pre-RP1 schemes. POPEs for smart motorways are discussed in paragraphs 1.34 to 1.37. We expect to see the company deliver actions to improve the timeliness of its POPE delivery. We will hold the company to account for delivery against its programme.
Capability and capacity to deliver RIS2 enhancements Collapse accordion Open accordion
B.28 We jointly commissioned with National Highways a review of the company’s capability and capacity to plan and deliver its RIS2 enhancements programme. We published the report in July 2021. In September 2021, the company shared with us its plan to address the recommendations of the review and give us confidence as to how it would drive continuous improvement within its project teams.
B.29 National Highways has made steady progress against all the review’s recommendations. In line with the plan, over 2021-22 the company focused on sharing lessons learned and embedding new ways of working across its business. It also increased its capability and capacity by recruiting new staff and improving the competency of its existing staff. The company completed several actions in 2021-22, including:
- system integration and embedding integrated project controls across project teams and the supply chain;
- embedding business change managers into delivery teams to play a pivotal role in dealing with change resistance and ensure that the changes were implemented effectively; and
- improving the competency of existing and new staff, broadening routes to professional qualifications, and aligning competency development with annual performance reviews and objective setting.
B.30 Due to the scale of the change required, National Highways opted to trial several of the new initiatives on a limited number of its enhancements schemes. In 2022-23, the company will continue to transition towards full transformation of systems and working processes. This will be crucial to bed in new ways of working. We will evaluate the company's progress and report back in next year’s annual assessment.
Earned value metrics Collapse accordion Open accordion
B.31 Earned value metrics cover National Highways’ supply chain performance against the cost and schedule variances of enhancements construction. Therefore, these metrics are not necessarily a direct reflection of the company’s performance. For example, a supplier may be behind its contract schedule in a metric, but the company could still deliver the relevant commitment on time. However, these metrics are indicative of how effectively the company manages its supply chain.
B.32 We assess National Highways’ earned value metrics through two commonly used measures:
- cost performance index (CPI): a ratio that measures the budgeted cost of work performed to date against actual cost to date; and
- schedule performance index (SPI): a ratio that measures the relationship between the progress of work to date and planned (or scheduled) progress.
B.33 If the CPI is greater than 1 the task is under budget, if it is less than 1 it is over budget. If the SPI is greater than 1 the task is ahead of schedule, if it is less than 1 it is behind schedule.
B.34 Figure B.16 shows the 17 schemes in construction that are reporting either CPI or SPI below 0.9 or greater than 1.1. Detail of all 37 reported CPI and SPI scores can be found in Table B.16. National Highways should use these scores to manage the performance of its supply chain partners. Across 2022-23, we expect to receive validated data that will allow us to hold the company to account for these scores during the remainder of RP2.
Figure B.16 Schemes under construction with reported CPI or SPI <0.9 or >1.1 at Q4 2021-22
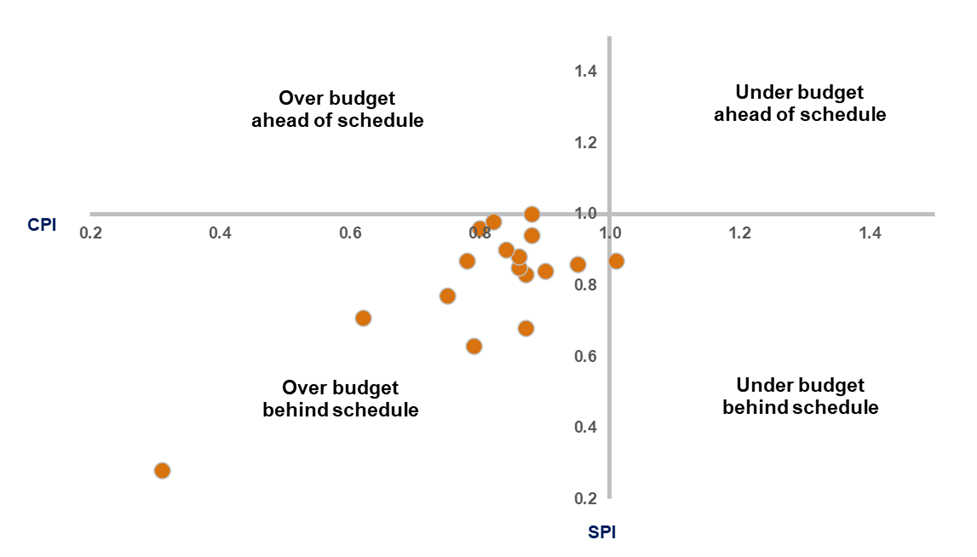
B.35 Table B.16 shows all the CPI and SPI scores reported by National Highways at the end of 2021-22. We will hold the company to account for improving these scores during the remainder of RP2.
Table B.16 CPI and SPI scores reported as at year-end 2021-22
| Scheme name | CPI | SPI |
|---|---|---|
| M6 Junction 10 | 0.90 | 0.84 |
| M42 Junction 6 | 0.86 | 0.88 |
| A46 Coventry Junctions | 0.84 | 0.90 |
| A52 Nottingham Junctions | 0.94 | 0.90 |
| A500 Etruria Valley* | 0.00 | 0.00 |
| M6 Junction 19 | 0.88 | 1.00 |
| A61 Westwood Roundabout | 1.01 | 0.98 |
| A585 Windy Harbour to Skippool | 0.88 | 0.94 |
| A63 Castle Street | 0.96 | 0.95 |
| A19 Testos | 0.90 | 1.00 |
| A19 Downhill Lane | 0.90 | 0.96 |
| A19 Norton to Wynyard | 0.86 | 0.85 |
| A1 Scotswood to North Brunton | 0.94 | 0.95 |
| A1 Birtley to Coal House | 0.79 | 0.63 |
| A47 Guyhirn Junction | 0.62 | 0.71 |
| A2 Bean and Ebbsfleet | 0.80 | 0.96 |
| A27 East of Lewes | 0.31 | 0.28 |
| M25 Junction 25 | 1.03 | 1.00 |
| A31 Ringwood | 0.75 | 0.77 |
| M2 Junction 5 | 1.00 | 1.01 |
| A303 Sparkford to Ilchester | 0.87 | 0.83 |
| A30 Chiverton to Carland Cross | 1.01 | 0.87 |
| National Stopped Vehicle Detection | 0.97 | 1.07 |
| M3 Junctions 9-14 | 0.82 | 0.98 |
| M40/M42 Interchange | 0.94 | 0.97 |
| M62 Junctions 20-25 | 0.99 | 0.97 |
| M1 Junctions 13-16 | 1.00 | 0.96 |
| M4 Junction 3-12 | 0.98 | 0.96 |
| M6 Junction 13-15 | 1.00 | 1.00 |
| M27 Junction 4-11 | 0.78 | 0.87 |
| M56 Junction 6-8 | 0.87 | 0.68 |
| M6 Junction 21A-26 | 0.95 | 0.86 |
| A1(M) Junctions 6-8** | 1.00 | 0.82 |
| M20 Junctions 3-5* | 0.98 | 0.67 |
| M23 Junctions 8-10* | 0.98 | 0.71 |
| M62 Junction 10-12* | 0.88 | 0.83 |
| M6 Junction 2-4* | 0.94 | 0.94 |
* scheme OFT
** deferred to RIS3
Annex C: Maintenance and renewals
Maintenance Collapse accordion Open accordion
C.1 National Highways has a legal duty under the Highways Act 1980 and its licence to maintain the strategic road network (SRN). Maintenance is split into two budget categories:
- routine cyclical and reactive work to keep users safe and the network serviceable (resource); and
- renewal of life-expired assets (capital).
C.2 Table C.1 shows a summary of the key performance indicators (KPIs) and performance indicators (PIs) that the company reports against each category in the second road investment strategy (RIS2).
Table C.1 Maintenance categories
| Maintenance type | Primary reporting source | RIS2 performance metrics |
|---|---|---|
| Capital maintenance – renewal of assets (£885m in 2021-22) | Renewals delivered against annual commitment Capital budget expenditure |
Pavement condition KPI Structures condition PI Geotechnical condition PI Drainage resilience PI Technology availability PI |
| Resource maintenance – fixing defects, e.g. potholes, routine maintenance, e.g. cleansing drainage systems, and inspections (£497m in 2021-22) | Maintenance performance statement (defects, cyclical and reactive maintenance, inspections) Resource budget expenditure |
Pavement condition KPI Structures condition PI Geotechnical condition PI Drainage resilience PI Technology availability PI |
C.3 In the first road period (RP1), we worked with National Highways to develop reporting that would show how well it is inspecting and maintaining the SRN. 2021-22 was the third year that the company consistently reported on its maintenance activity metrics. This has improved our visibility of and confidence in the company’s maintenance performance. The company’s transition from legacy contracts with its service providers and supply chain to the Asset Delivery (AD) contract model helped it to improve its reporting in 2021-22 (see paragraph 2.40).
C.4 National Highways’ published performance monitoring statements show detailed maintenance performance data. We discuss the company’s performance in more detail below.
Maintenance activity performance
C.5 Table C.2 shows how National Highways’ performance at delivering winter services, collecting litter, and undertaking cyclical and reactive maintenance has changed since 2020-21.
C.6 In 2021-22, National Highways improved its cyclical maintenance performance compared to 2020-21. However, the company delivered less than 80% of its planned cyclical maintenance within the required timescales. The company told us that it is trialling new internal reporting to improve its performance by enabling regional teams to better track their performance to amend future programmes in real time.
C.7 National Highways also reported a drop in its litter clearance performance, largely due to one region. The company collects litter cyclically and reactively as part of its wider maintenance portfolio. It told us that it is necessary at times to prioritise maintenance activities that maintain safety and performance over litter collection. This can impact its litter clearance activity. The company considers performance above 90% to be good.
Table C.2 Summary of National Highways’ maintenance activity performance between April 2018 and March 2022
| Maintenance Activity | Activity Description | 2018-19 (%) | 2019-20 (%) | 2020-21 (%) | 2021-22 (%) |
|---|---|---|---|---|---|
| Winter service | The percentage of precautionary salting delivered within time | 96 | 100 | 100 | 99 |
| Winter service | Percentage of instances where running lanes were available | 95 | 100 | 100 | 100 |
| Litter | Percentage of planned litter clearance activities undertaken | Not available | 89 | 95 | 92 |
| Cyclical maintenance (AD areas only) |
Percentage of cyclic works that are completed within the required timescales | 82 | 81 | 77 | 79 |
| Reactive maintenance (AD areas only) |
Percentage of reactive <24hr works that are completed within the required timescales | Not available | 88 | 91 | 93 |
Defect management
C.8 An important indicator of maintenance performance is how promptly National Highways addresses defects such as potholes. Tables C.3 and C.4 summarise defect performance across 2019-20 and 2021-22. Two categories of performance are provided:
- the percentage of high priority defects addressed within 24 hours; and
- the percentage of other defects addressed within the required timescale for that defect type.
C.9 In 2021-22 National Highways merged some of the defect type categories that it reports performance against. Table C.3 shows the gaps in performance data that have emerged as a result. The company reported that this was to align with its revised data standards. We are concerned that this reduces the transparency of performance for particular asset types. For example, signage defect performance was reported in its own category previously but has been merged with road markings and road studs. This limits our understanding of signage performance.
C.10 Transport Focus identified signage defects in one of its campaigns due to the importance of good signage to users. As highlighted in our key message, National Highways must show that it is addressing the right assets at the right time and so reducing asset performance transparency may limit a clear demonstration of this.
C.11 National Highways reported that it has maintained strong overall defect performance. In the defect types that it has reported consistently since 2020-21, 24-hour priority defect performance has improved over most assets including road surfacing and safety barriers. Its performance at addressing lower priority defects has reduced over most defect types since 2020-21, although none have dropped below performance levels in the first year of reporting, 2019-20.
Table C.3 Summary of National Highways’ priority defects performance between April 2019 and March 2022 - 24-hour priority defects (%)
| Defect type | 2019-20 | 2020-21 | 2021-22 |
|---|---|---|---|
| Paved area (road surfacing) | 90.6 | 94.7 | 94.8 |
| Road markings and road studs | 93.5 | 95.1 | Not applicable |
| Traffic signs, road markings and road studs | Not applicable | Not applicable | 95.6 |
| Vehicle restraint systems (safety barriers) | 95.0 | 92.7 | 93.8 |
| Lighting | 81.1 | 89.8 | 91.5 |
| Signage | 89.0 | 93.1 | Not applicable |
| Soft estate (AD areas) | 90.3 | 90.9 | 94.9 |
| Reactive sweeping and cleaning actions (excluding graffiti) (AD areas) | 96.9 | 97.4 | Not applicable |
| Sweeping and cleaning - offensive graffiti | 100.0 | 80.0 | Not applicable |
| Sweeping and cleaning (including offensive and non-offensive graffiti) | Not applicable | Not applicable | 93.1 |
| Fences and walls | 91.2 | 97.7 | 96.0 |
| Drainage and service ducts (AD areas) | 91.1 | 94.0 | 94.3 |
| Geotechnical (AD areas) | 83.3 | 100.0 | 99.4 |
| Structures (AD areas) | 85.1 | 98.3 | 92.5 |
Table C.4 Summary of National Highways’ non-priority defect performance between April 2019 and March 2022 - Required timescale (%)
| Defect type | 2019-20 | 2020-21 | 2021-22 |
|---|---|---|---|
| Paved area (road surfacing) | 85.6 | 95.4 | 94.5 |
| Road markings and road studs | 77.4 | 93.4 | Not applicable |
| Traffic signs, road markings and road studs | Not applicable | Not applicable | 91.5 |
| Vehicle restraint systems (safety barriers) | 77.7 | 93.0 | 89.1 |
| Lighting | 84.3 | 86.3 | 88.9 |
| Signage | 81.7 | 93.5 | Not applicable |
| Soft estate (AD areas) | 75.8 | 87.7 | 85.1 |
| Reactive sweeping and cleaning actions (excluding graffiti) (AD areas) | 90.0 | 95.1 | Not applicable |
| Sweeping and cleaning - offensive graffiti | 78.3 | 95.6 | Not applicable |
| Sweeping and cleaning (including offensive and non-offensive graffiti) | Not applicable | Not applicable | Not applicable |
| Fences and walls | 79.4 | 95.1 | 93.3 |
| Drainage and service ducts (AD areas) | 69.5 | 91.0 | 87.3 |
| Geotechnical (AD areas) | 77.3 | 100.0 | 94.9 |
| Structures (AD areas) | 75.3 | 96.2 | 93.1 |
Insurance claims processing
C.12 Green and red claims summarise insurance claims against motorists or their insurers, or against National Highways. They provide an indication of the company’s performance against its statutory obligations and how well it is recouping financial loss:
- Green claims occur where the SRN has been damaged by a road user, for example from a collision, and the company needs to recoup costs to repair the asset damage; and
- Red claims are processed where a loss has occurred to a road user as a result of the company not meeting its requirements to maintain the highway and the company pays out for the loss.
C.13 Table C.5 provides a summary of the number of claims and number of settled claims of each type. In 2021-22 National Highways reported that it saw an increase in the number of green claims due to more regions transferring to the AD model and so the company handles claims directly. It settled the highest number of green claims since it started reporting figures. The company reported that the number of red claims was consistent with previous years.
C.14 Claim data is currently presented in a way that shows how efficient National Highways’ claim handling process is. For example, the data shows how the company has improved the number of green claims it has settled which. This means it has positively recouped costs to repair asset damage. We have started working with the company to review links with other maintenance performance measures. This would include any correlation between red claims, cyclical maintenance performance and the number of defects on the SRN.
Table C.5 Summary of National Highways’ claims handling performance between April 2018 and March 2022
C.5a - Number of claims
| Claim type | 2018-19 | 2019-20 | 2020-21 | 2021-22 |
|---|---|---|---|---|
| Red claims | 2,239 | 1,751 | 1,284 | 1,198 |
| Green claims | 4,937 | 3,906 | 5,155 | 6,898 |
C.5b - Number of settled claims
| Claim type | 2018-19 | 2019-20 | 2020-21 | 2021-22 |
|---|---|---|---|---|
| Red claims | 992 | 394 | 764 | 512 |
| Green claims | Not available | 706 | 3,848 | 7,420 |
Asset inspection performance
C.15 Inspection performance is important because it shows that National Highways is meeting its requirements to inspect the SRN and gives us confidence that the asset performance that the company reports under its key performance indicators (KPIs) and performance indicators (PIs) is based on accurate, timely condition data. Table C.6 provides a summary of National Highways’ planned inspection performance.
C.16 National Highways improved the percentage of inspection programme completed for safety barriers, geotechnical, and traffic signs and technology assets in 2021-22. Lighting inspections and structures performance reduced. The company reported that its reduced performance is partly attributed to having physically completed the inspections but not validating them on asset data systems. The reporting of inspection performance does not currently include safety inspections. We will work with National Highways on this over 2022-23.
Table C.6 Summary of planned inspections that National Highways completed between April 2019 and March 2022 - Programme completed (%)
| Asset type | 2019-20 | 2020-21 | 2021-22 |
|---|---|---|---|
| Structures | 92.2 | 97.0 | 92.0 |
| Vehicle restraint system (safety barrier) | 79.4 | 84.7 | 88.0 |
| Lighting | 66.3 | 116.0 | 89.0 |
| Geotech | 82.8 | 95.0 | 101.0 |
| Traffic signs and technology | 92.3 | 85.0 | 101.0 |
Renewals Collapse accordion Open accordion
Asset renewal delivery
C.17 National Highways’ delivery plan for 2021-22 set out the volumes of renewals work it planned to deliver during the year. The company reports renewals work under two categories for the second road period (RP2): routine cyclical renewals (similar to reporting in RP1); and a new category of work termed major life-extension renewals. Major life-extension renewals include:
- road surfacing – asphalt and concrete;
- safety barriers – steel and concrete; and
- significant structures (such as the refurbishment of bridges with greatest need).
C.18 In 2021-22, National Highways delivered its planned volumes of renewals against all major life-extension assets and all but four routine cyclical asset types. The company reported the following reasons for missing its renewals targets:
- waterproofing (-25%) – planned schemes in the East region were not delivered due to constraints on road space, and in the Yorkshire and North-East region due to slower than planned transition to AD;
- lighting (-6%) – missed commitment due to misclassification of lighting work undertaken in the South-West region;
- technology renewals (-0.3%) – missed commitment by one technology unit; and
- parapet (-0.02%) – missed commitment by one metre of bridge parapet.
C.19 Across all renewals output asset types, National Highways delivered closer to plan in 2021-22, the second year of RP2, compared to the first year of RP2. In 2020-21 the company delivered a variance between actual and planned outputs in excess of 50% against six asset renewals types, with three of those in excess of 200%. In 2021-22 the company only had a variance greater than 50% in the bridge bearings asset category. The company reported that this was due to schemes largely in the East region that had started in 2020-21 but completed in 2021-22.
Table C.7 Volumes of renewals delivered compared to plan between April 2021 and March 2022
C.7a - Major life-extension renewals
| 2021-22 commitments | Planned output | Actual output | Output variance (%) |
|---|---|---|---|
| Safety barriers - steel (kilometres) | 382.0 | 563.4 | 47 |
| Safety barriers - concrete (kilometres) | 2.6 | 3.1 | 19 |
| Road surface - asphalt (lane kilometres) | 1,490.0 | 1,704.3 | 13 |
| Significant structures (number) | 26 | 27 | 4 |
| Road surface - concrete (lane kilometres) | 101.0 | 108.3 | 7 |
C.7b - Renewal of roads
| 2021-22 commitments | Planned output | Actual output | Output variance (%) |
|---|---|---|---|
| Traffic signs (number) | 1,100 | 1,534 | 39 |
| Kerbs (kilometres) | 13.4 | 18.4 | 37 |
| Drainage (kilometres) | 148.0 | 178.5 | 21 |
| Road markings (kilometres) | 3,450.0 | 4,140.5 | 20 |
| Guardrail (kilometres) | 0.8 | 0.9 | 14 |
| Boundary fencing (kilometres) | 64.0 | 70.1 | 10 |
| Geotechnical (kilometres) | 2.9 | 3.1 | 9 |
| Lighting (number) | 1,050 | 992 | -6 |
C.7c - Renewal of structures
| 2021-22 commitments | Planned output | Actual output | Output variance (%) |
|---|---|---|---|
| Bridge bearing (number) | 90 | 172 | 91 |
| Bridge joint (number) | 450 | 516 | 15 |
| Parapet (kilometres) | 5.1 | 5.1 | -0.02 |
| Waterproofing (square metres) | 32,500 | 24,270 | -25 |
C.7d - Renewal of technology
| 2021-22 commitments | Planned output | Actual output | Output variance (%) |
|---|---|---|---|
| Motorway communication equipment (number) | 215 | 272 | 27 |
| Technology renewals and improvements (number) | 370 | 369 | -0.3 |
C.20 National Highways reported that due to favourable weather conditions in March 2022 it was able to deliver its highest capital maintenance spend in the last three months (Q4) of the financial year since 2014-15. Figure C.1 shows that the company delivered the majority of road surfacing (concrete and asphalt) renewals in Q4 2021-22, as was the case in 2020-21. The last three months of the financial year are typically not ideal for undertaking certain types of maintenance activity due to unfavourable weather conditions. This can result in poorer quality products that do not achieve expected service-life. Whilst favourable weather may improve productivity and quality, this should be reflected in reporting to demonstrate the right asset was treated at the right time.
Figure C.1 Quarterly volumes of pavement renewals delivered between April 2015 and March 2022