
Over £22 billion* is spent every year by UK rail and each year we publish two reports which look deeper at where this money comes from and where it is spent.
Financial Statistics published by the ORR
The UK Rail Industry Financials details the income and expenditure of over 40 companies, such as train operators, infrastructure managers (Network Rail and HS1), freight companies and Northern Ireland Railways. The Rail Finance Annual Statistical Release is a shorter report and focuses on government funding and private investment.
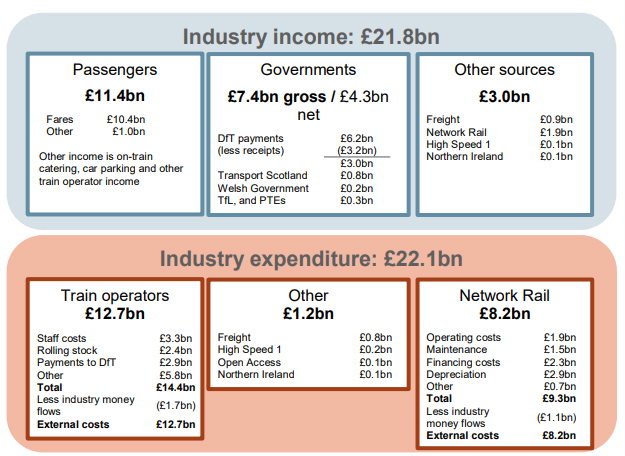
The figure below is from our UK Rail Industry Financials and summarises the total income and expenditure for the industry in the 2018-19 financial year. This is an independent and transparent report which looks into the significant money that is invested in the railway each year.
Figure 1: Railway income and expenditure in 2018-19
Proposals for our future reporting
We want to make sure our rail finance reports continue to be relevant. That’s why we’re consulting on some of our proposed improvements and will implement any changes for our next reports in November 2020.
Combining our two reports
We want to combine the two reports which cover similar areas and are published at different times of the year, which can be confusing.
Efficiency of the railway
The efficiency of the railway is an increasingly important question, how do passengers and funders of the railway know that expenditure is value for money?
One way we can aid this analysis is by making simple comparisons, by looking at costs over time and making regional comparisons. For example we could show the costs per passenger kilometre in one region compared to other regions.
We understand that this is a complex area. For example if the costs in one part of the country were higher than in the rest of the country, that may be because the railway is older, so the difference may not be due to efficiency.
Having like with like comparisons are important and when interpreting this analysis we will, where possible, account for the local differences.
Better explanation of cost drivers
It is fair to say that in the past we have reported the numbers without fully explaining why some costs increase or decrease.
For example we were recently asked to explain some of the changes in rolling stock leasing costs. There are many different reasons why these may change, for example due to new trains or change in contracts etc. We will aim to work a lot more closely with the industry to understand the drivers of these costs and improve the quality of our analysis.
User experience
We have recently upgraded our public facing ‘data portal’, which brings together all of our statistics. We will start to use this for our railway finance statistics allowing users to download the data, come up with their own datasets and make their own charts.
Next steps
We would like to hear your views on our proposals. If you would like to contact us directly then you can reach us on the following email richard.connor@orr.gov.uk. We have also set up a survey to hear your views on our proposals which should only take 5-10 minutes of your time.
Over the summer we will continue our work with the industry and publish in November 2020.
*The effect of Covid-19 is having a significant impact on the industry's finances and the numbers below do not reflect the current situation faced by the industry. We will report more fully on this impact in the future.