ORR’s role is to hold National Highways to account to deliver the road investment strategy (RIS). The Performance Specification forms part of the RIS. It is published by the Department for Transport (DfT) and sets out what it expects National Highways to deliver in the road period. For the second road investment strategy (RIS2) it includes 12 key performance indicator (KPI) targets covering the outcome areas of:
- improving safety for all;
- providing fast and reliable journeys;
- a well maintained and resilient network;
- being environmentally responsible;
- meeting the needs of all users; and
- achieving efficient delivery.
These are supported by a suite of performance indicators (PIs), detailed in the Operational Metrics Manual. This chapter sets out National Highways’ performance against all its KPIs, and selected PIs where stakeholder interest is greatest. Data for all KPIs and PIs, are published on our website.
Performance overview
National Highways met seven of the 12 KPIs that it was set for the second road period (RP2). The company missed four KPIs and is forecast to miss its KPI for safety that runs to the end of December 2025.
Table 2.1 End of RP2 performance overview
| KPI and Target | End of road period performance | Target outcome |
|---|---|---|
| Killed or seriously injured casualties – 50% reduction by end of 2025 compared the 2005 to 2009 baseline | At the end of 2023, National Highways had achieved a 39% reduction in people killed or seriously injured | Final data for RP2 will be reported in September 2026 |
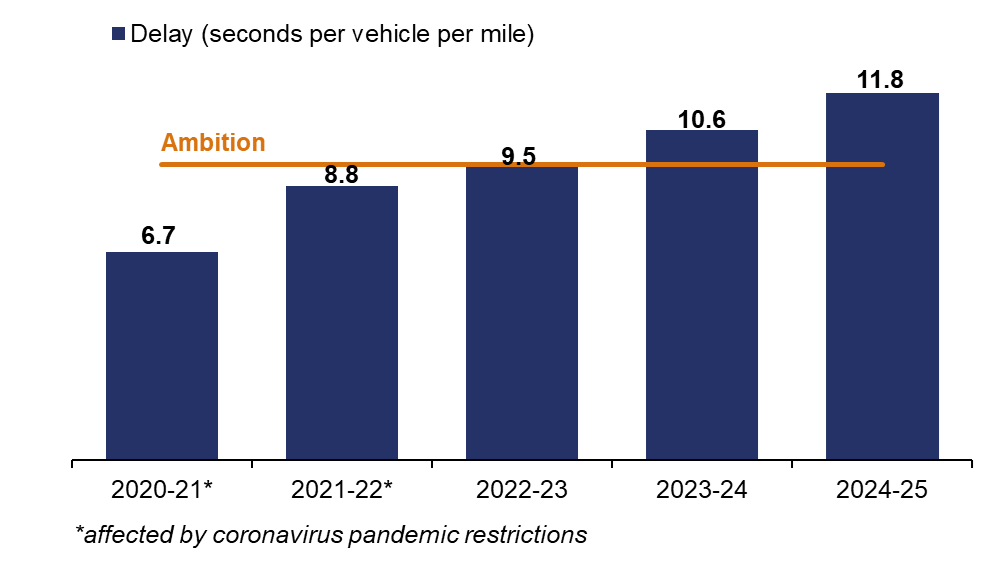
| Average delay – ambition to be no worse at the end of RP2 than it was at the end of RP1 | Delay was 11.8 seconds per vehicle mile, which is higher than 9.5 seconds per vehicle per mile in February 2020 | Ambition not met |
| Roadworks network impact – Not to exceed 51 million lane metre days | Roadworks network impact was 41.8 million lane metre days | Target met |
| Incident clearance rate – 86% of motorway incidents cleared within one hour | 88.7% of incidents were cleared within one hour | Target met |
| Pavement condition – 96.2% of road surface (all lanes) in good condition | 96.5% of road surface was in good condition | Target met |
| Noise – 7,500 households mitigated in noise important areas | 7,776 households were mitigated from noise | Target met |
| Biodiversity – No net loss of biodiversity by the end of RP2 | National Highways delivered a net gain of 596 biodiversity units | Target met |
| Air quality – Bring sections of the network into compliance with legal nitrogen dioxide levels in the shortest time possible | 19 sections of the network remain non-compliant. National Highways has made acceptable progress | Target met |
| Corporate carbon emissions – 56% reduction by the end of RP2 compared to the 2017 to 2018 baseline | Corporate carbon emissions are 51% lower compared to the baseline | Target not met |
| Road user satisfaction – 71% of users satisfied with their journey | 68.6% of road users were satisfied with their journey | Target not met |
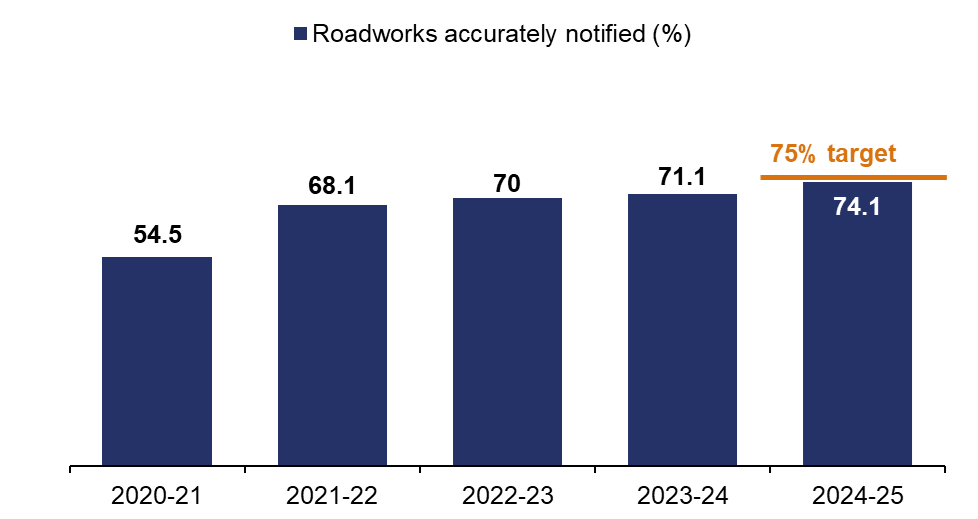
| Roadworks information and timeliness – 75% of overnight road closures accurately notified 7 days in advance | 74.1% of overnight road closures were accurately notified in advance | Target not met |
| Efficiency - £2.0 billion of capital and operational efficiency | £2.2 billion of capital and operational efficiency | Target met |
Improving safety for all
KPI: number of people killed or seriously injured on the SRN
National Highways has a target to halve the number of people killed or seriously injured (KSIs) on the strategic road network (SRN) by the end of December 2025, compared to a 2005 to 2009 average baseline.
In March 2025 we published our third annual assessment of safety performance on the SRN. We reported that by the end of 2023, National Highways has achieved a 39% reduction in the number of KSIs on the SRN compared to the baseline. These data continue the long term trend of decreasing deaths and serious injuries on the SRN, with the latest statistics showing the fewest KSI casualties ever recorded, excluding 2020 and 2021, when there was significantly less traffic using the SRN due to the pandemic.
In previous annual safety reports we highlighted that the safety KPI target was at risk and required National Highways to produce a plan setting out how it aims to meet the target. At the end of March 2025, the company had delivered 33 actions of the 43 actions that were included in its enhanced safety plan. It plans to deliver eight more by the end of 2025, with one scheme removed from the plan following objections from a local authority. The remaining action is related to the Roads Policing Review and will be taken forward once government publishes its response to the review.
Despite these interventions, National Highways remains off course to achieve its December 2025 target. We consider that, in 2025, the company is doing everything that it can in the final year to try and meet the target, but it is improbable that it will achieve this by the end of December 2025.
While we recognise that not all actions to reduce KSIs on the SRN are fully within National Highways’ control, it is important that the company continues to use its position in the sector to influence, and work closely with other agencies, to support its longer term vision of zero harm on the SRN.
We will report on the final position against the RIS2 safety KPI after DfT publishes 2025 road casualty data in September 2026.
PI: Accident frequency rate for National Highways’ staff and supply chain
National Highways has two PIs that measure the safety of workers. The accident frequency rate (AFR) for its own employees, and those working in its supply chain, is based on the number of RIDDOR (Reporting of Injuries, Diseases and Dangerous Occurrences Regulations 2013) incidents per 100,000 hours worked.
National Highways' employee AFR has remained at a similar level throughout RP2. At the end of year 5 it was 0.06 per 100,000 hours worked, compared to 0.05 in the first year of the road period and 0.07 at the end of year 4.
The year 5 supply chain AFR was 0.09 per 100,000 hours worked, an increase from 0.05 in the first year of the road period and from 0.07 in year 4.
National Highways has told us that, as a result of the increase in the supply chain AFR, it is engaging directly with suppliers to fully understand the reasons for the increase. We are actively monitoring the company’s progress in this area and will review the actions that it plans to take following completion of its review.
Providing fast and reliable journeys
KPI: Average delay
Research by Transport Focus shows that satisfaction with journey time has the greatest impact on road users’ overall satisfaction with their journey. Businesses, including bus and coach operators and logistics firms also rely on predictable journey times on the SRN.
For RIS2, government set National Highways an ambition for average delay on the SRN to be no worse at the end of RP2 than it was at the end of RP1. This was 9.5 seconds per vehicle per mile (spvpm). At the end of RP2, average delay was 11.8 spvpm. This fell short of National Highways’ RIS2 ambition of 9.5 spvpm for average delay.
Throughout the road period, National Highways demonstrated that it was taking action to address delay, by delivering its plan for managing delay on the SRN, published in 2021. At the end of RP2, 15 out of 17 actions in the original plan were complete. The company did not fully deliver actions related to:
- travel demand management initiatives for roadworks, where it did not pursue a travel demand initiative on the M25 due to the impact of the pandemic and associated reduction in traffic; and
- the use of vehicle data to improve knowledge of incidents, where it continues to evaluate potential uses of vehicle data.
Delay on the SRN is impacted by several factors within and outside of National Highways’ direct control. For example, some factors within its control that influence journey times on the network include how effectively the company manages roadworks and clears incidents. It has achieved KPI targets in both areas in RP2 (discussed in more detail below).
The volume of traffic using the SRN is a significant factor outside of National Highways’ control that influences delay. DfT forecasted SRN traffic volumes to increase during RP2 by 5%. Following a decrease during the pandemic, traffic volumes in 2025 are similar to pre-pandemic levels. Therefore, National Highways has benefited from lower traffic volumes than expected in the final year of RP2. Despite this, average delay at the end of RP2 was 2.3 spvpm higher than the pre-pandemic baseline.
In April 2023, when National Highways was missing its ambition level, ORR challenged the company to explain why delays were increasing at a higher rate than traffic growth, and how its actions from managing delay on the SRN were mitigating this. In 2024, the company demonstrated that some of the increase was due to the impact of the national emergency area retrofit (NEAR) programme. This was estimated to contribute an additional 0.7 spvpm to average delay. However, it was unable to fully explain why delays increased as much as they have over RP2 compared to previously predicted levels.
We investigated this further, as part of our 2024 investigation into National Highways’ delivery of RIS2. We raised concerns about the company’s ability to gather, understand and provide evidence on the impact of the activities it was undertaking to mitigate delay. In response to our investigation, the company developed an improvement plan that includes a programme of analysis and research to increase its understanding of delays on the SRN and develop regional delay plans. This now forms part of the company’s Customer and Delay plan for the interim period that we will hold it to account to deliver.
Going forward, National Highways must be able to better target interventions to alleviate delay. To do this it needs to improve its evidence and understanding as to why delays have increased at a higher rate than traffic volumes since the end of the pandemic. Notably it should quantify the extent to which changes in the use and variation in the vehicle fleet (for example the increase in light goods vehicles) since the pandemic has impacted delay. This will allow it to adjust its approach to respond and improve the effects of its interventions for users.
Figure 2.1 Average delay KPI, annual data, April 2020 to March 2025
KPI: Roadworks network impact
This KPI incentivises National Highways to mitigate the impact of roadworks for road users by keeping lanes open or using higher speed limits where it is safe to do so. Measured in ‘lane metre days’, it assesses the impact of roadworks on the SRN based on the length of roadworks; the amount of time they are in place; the number of lanes affected; and any width or speed restrictions applied.
National Highways’ original year 5 target was to remain below 47 million lane metres days. In April 2024, the company proposed to change the target. This was to take account of the NEAR programme that required additional lane closures not expected when the original target was set. Government agreed to increase the target to 51 million lane metre days.
National Highways met its target in each year of RP2. At the end of the road period, roadworks network impact was 41.8 million lane metre days, better than its year 5 target to be less than 51 million lane metre days.
However, in year 5, the impact of the NEAR programme did not result in the change in performance that National Highways expected. This highlighted a shortcoming in the company’s ability to understand how different factors affect performance and resulted in a revised target being set that reflected a high level of uncertainty in expected outturn performance that was not needed.
At the time, ORR advised that the revised target should be sufficiently stretching to incentivise National Highways to minimise the impact of roadworks on road users. The company should consider how it can improve its capability to predict performance and reduce the size of confidence factors to ensure it maximises the opportunities to drive improvements for road users.
KPI: Incident clearance rate
National Highways’ RIS2 outcome of providing fast and reliable journeys on the SRN is supported by a KPI to clear incidents on motorways in a timely manner. The target was for the company to clear at least 86% of motorway incidents affecting traffic flow in under an hour.
National Highways has exceeded the target throughout RP2, consistently maintaining performance above 86% and achieving 88.7% at the end of the road period. The company has attributed its strong performance in this area to work it has undertaken to optimise patrol strategies, and improvements in how it shares information internally to allow traffic officers and staff in control centres to access key network information through a single platform.
During RP2, National Highways was also tasked with achieving an average attendance time of under 10 minutes for traffic officers responding to live lane stops on all lane running smart motorways where emergency areas were further than one mile apart. ORR’s intervention in this area during 2022 has supported the company to develop a better understanding of how the actions it takes can deliver a better service for road users and also contributed to improved KPI performance during RP2.
A well maintained and resilient network
KPI: Pavement condition
Maintaining the SRN is a key component of meeting customer expectations. Efficient maintenance and renewals delivery minimises disruption for road users. This KPI measures the percentage of the road surface in good condition.
National Highways had an annual target for 96.2% of pavement (road surface) to be in good condition. In December 2022, performance dropped below target. We worked with the company to understand the causes of the issue and its plans to improve, including conducting our 2024 investigation. We found that the company was unable to demonstrate its regional road surfacing plans were aligned to its national target. In response, the company improved its use of data to identify the sections of the network that have the greatest impact on the KPI. Through improved forecasting and delivery of specific resurfacing schemes, it now delivers a more targeted programme of work focused on the highest-risk areas, that better supports achievement of the national target.
Consequently, in year 5 National Highways exceeded its target, with 96.5% of the road surface in good condition at the end of RP2.
PI: Technology availability
The availability of technology, such as variable message signs and signals, on the SRN is a high priority for road users. This PI measures the percentage of time that roadside technology services are available and functioning.
The PI has no specific target, but the company set an internal target of 95% availability. The PI includes all technology on the SRN, including smart motorways, however, the availability of technology on smart motorways is reported separately in our annual assessment of safety performance on the SRN. Availability for key smart motorway technology assets at the end of year 5 was 94.3%.
Technology availability on the SRN as a whole reduced to 90.0% at the end of RP2, compared to 97.6% in 2022, the earliest comparable data. In 2023, National Highways made changes to improve the accuracy of how these data were reported. This change was intended to better identify service affecting faults and improve how fault resolution is prioritised and had the effect of reducing reported performance figures by an estimated 2.5 percentage points.
National Highways’ progress in relation to technology availability on the SRN and our next steps are described in more detail in the Operations, maintenance and renewals chapter.
PI: Drainage resilience
Drainage resilience captures the length of the network with a drainage catchment that does not have a high-risk flood hotspot within it.
At the end of RP2, drainage resilience was 72%. This equates to 28% of the SRN having observed significant susceptibility to flooding. This was the same level as 2022, the earliest comparable data. Performance excludes rainfall events that exceed a 1 in 5 year rainfall event. When all rainfall events are included, performance worsens to 70% of the network. National Highways’ progress in relation to drainage resilience and our next steps are described in more detail in the Operations, maintenance and renewals chapter.
Being environmentally responsible
KPI: Corporate carbon emissions
National Highways is required to support the Greening Government Commitments, a set of actions that UK Government departments and their agencies will take to reduce their environmental impact. As part of this, the company had a KPI target to reduce its corporate carbon emissions by 56% by the end of RP2, compared to an April 2017 to March 2018 baseline.
In October 2024, government agreed to change National Highways’ RP2 corporate carbon target from a 67% reduction compared to the baseline to a 56% reduction. This was due to slower decarbonisation of the electricity grid than was expected when the target was originally set and a change in emission factors for plug-in hybrid vehicles.
Electricity usage is the biggest contributor to National Highways’ corporate carbon emissions. At the end of RP2, the company reduced its electricity use by 17% compared to its April 2017 to March 2018 baseline, behind its forecast for a 22% reduction. The biggest single action that the company is taking to reduce its electricity usage is its programme to replace conventional streetlights with LED lighting.
In 2024, we identified that this target was at risk and challenged National Highways to accelerate its LED programme to achieve its carbon KPI. It provided us with evidence showing it had considered this but concluded the benefits would be outweighed by the detrimental impact on road users caused by the lane closures that would be required.
National Highways’ performance against this target was affected by several factors that resulted in higher carbon emissions than expected during RP2. These included higher than expected traffic officer mileage, and slower than expected adoption of electric vehicles by hire car companies, resulting in higher than modelled emissions from business travel. Some of this was offset by changes to the company’s commitments in RP2, for example the cancellation of smart motorway schemes.
In the final year of RP2, National Highways’ survey of its streetlighting identified more lighting columns and higher-power bulbs than expected, leading to additional assets contributing to the company’s total electricity use. This resulted in a larger gap between the company’s performance and the target than previously forecast. This highlights the need for the company to improve its asset data to support better forecasting and target setting.
At the end of RP2, National Highways achieved a 51% reduction in its corporate carbon emissions compared to the baseline. Therefore, the company did not meet this KPI target of a 56% reduction for the road period. It emitted 45,232 tonnes of carbon dioxide equivalent (CO2e) from activities undertaken in the course of its day to day work in the final year of RP2. This is 4,895 tonnes worse than targeted, equal to 54,600 petrol car journeys from London to Glasgow.
KPI: Air quality
Government identified 128 sections of the SRN that may exceed legal limits for nitrogen dioxide, a pollutant common in vehicle exhaust emissions. In RP2, National Highways had a target to bring nitrogen dioxide levels on these sections into legal compliance in the shortest time possible. We engaged regularly with government and the Joint Air Quality Unit (JAQU) on monitoring progress in mitigating the effects of air pollution on the SRN.
During RP2, National Highways installed monitoring devices alongside these sections to review the actual nitrogen dioxide levels. At the end of the road period, there remain 19 sections that exceeded the legal limit for nitrogen dioxide. Of these, the company had two sections with mitigation measures in place, five sections with no viable measures and 12 sections with measures in development.
We recognise that National Highways has limited control over many factors that influence air quality. Based on the evidence, and engagement with JAQU, we consider that the company made all reasonable efforts to deliver its obligations on air quality. For those sections which continue to exceed the legal limits, we will continue to engage with government, JAQU and the company to assess its progress in implementing mitigation schemes at these locations.
KPI: Biodiversity
Biodiversity is the variety of animal and plant life, with a vital role in sustaining our natural environment. A biodiversity unit is linked to the size, condition and location of a habitat or piece of land. In 2020, National Highways calculated that across its estate it had 130,848 biodiversity units. This covers all the company’s land, including verges either side of the carriageway.
National Highways’ target was to deliver no net loss in biodiversity by the end of RP2. The company estimated that without any additional biodiversity mitigation, there would be a loss of 6,148 biodiversity units over the road period.
National Highways responded well to our challenge earlier in RP2, when it was forecasting to miss its target. By developing and delivering a pipeline of biodiversity schemes, the company performed well against this KPI. It delivered a total of 6,744 biodiversity units, resulting in a net gain of 596 biodiversity units. It therefore exceeded its target to achieve no net loss in biodiversity by the end of the road period.
KPI: Noise
Households near the SRN experience substantial noise pollution, mostly from vehicle tyres and engine noise. National Highways has a programme to mitigate noise, through either laying lower noise surfacing, upgrading insulation in affected households or installing noise barriers.
National Highways’ KPI target was to mitigate noise for 7,500 households by the end of RP2. It exceeded that target and mitigated noise from 7,776 households through a mixture of lower-noise road surfacing, noise barriers and upgrading insulation of affected properties.
PI: Litter
Litter is a concern for road users and the public. It is the responsibility of National Highways and local highways authorities to clear litter from the SRN and work with stakeholders to reduce levels of littering, as explained in the company’s litter strategy. We report the level of litter on the network through the untargeted litter PI. However, the company has responsibility for collecting litter under the Environmental Protection Act 1990.
In RP2, performance improved, with National Highways surveying the SRN and reporting that 59.8% of its network was rated at Grade A or B according to Defra’s litter code of practice. This was better than 49.2% at the start of the road period.
The best performing region was the North West, with 81.5% of its network rated Grade A or B, the worse performing region was the Midlands, with 43.7% of its network rated Grade A or B.
National Highways must continue to work in partnership with local authorities to improve coordination of activities which would allow access to its network for litter picking.
Meeting the needs of all road users
KPI: Road user satisfaction
The Strategic Roads User Survey (SRUS) measures users’ satisfaction with a single journey on one road of the SRN within the last 28 days. The online survey, managed by Transport Focus, measures different aspects of users’ journeys including their overall satisfaction.
In each year of RP2, National Highways produced an annual customer service plan. The company uses information from SRUS, customer research and input from Transport Focus to develop a set of actions that aim to address the issues that are most important to road users.
In the final year of RP2, National Highways’ customer service plan comprised 41 initiatives. The company successfully delivered 39 of these. The two initiatives not delivered related to the use of digital, data and technology to trial litter enforcement, and better information provision for travellers using the new National Traffic Information Service (NTIS). The litter enforcement trial was delayed due to the need to clarify the company’s legal powers, while the delay to better information provision for travellers was caused by the slower than scheduled rollout of the new NTIS. These initiatives are now planned for delivery in the interim period.
Government set National Highways a satisfaction target of 71% for year 5, down from 73% in the previous year. This reflected the expected impact of the NEAR programme and the limited amount of data that were available for target setting, following a pause in the survey during the pandemic and a subsequent change in methodology.
Road user satisfaction is closely related to the amount of disruption from roadworks experienced on the SRN. National Highways highlighted that increases in delay due to lane closures as part of the NEAR programme, which the company estimated to have peaked at 0.7 seconds per vehicle per mile, were likely to have a negative impact on user satisfaction in the final year of RP2.
Results from SRUS for the final year of RP2 showed that 68.6% of road users were fairly satisfied or very satisfied with their journey on the SRN, against a target of 71%.
Analysis of SRUS data in the final year of RP2 confirmed that lower levels of satisfaction correlated with locations where NEAR roadworks were in place, which explains some, but not all, of the observed decrease in performance. It also showed that overall satisfaction increased by a small amount in the final two months of the period, coinciding with the completion of these roadworks.
Our discussions with Transport Focus indicated that National Highways made progress in the road period to better understand and influence road user satisfaction in the future. It is important that the company continues to develop this work. It has set out details for how it intends to achieve this in a combined Customer and Delay plan for the interim period that recognises the close relationship between these two key areas. We will hold the company to account to deliver this plan in the interim period and the improvements it promises.
KPI: Roadworks information timeliness and accuracy
Road users, especially freight and logistics firms, rely on timely and accurate notice of road closures, especially overnight closures that require road users to use diversion routes.
When RIS2 was published, the target for this KPI was originally set at 90% of overnight road closures to be accurately notified seven days in advance by the end of RP2. At the start of RP2, performance was at 54.5%.
Following our intervention and challenge in 2023, National Highways produced and delivered performance improvement plans. This led to improved performance in the final two years of RP2.
Subsequently, National Highways’ analysis showed that the original target of 90% was unachievable, for example 12.8% of closures in the final year of RP2 were due to reasons outside the company’s control, such as unplanned safety repairs. The company proposed a lower target of 75% for the end of RP2. We considered this to be challenging and that it would continue to drive the right behaviours from it to deliver the best possible outcome for road users. This target change was agreed by government in 2024.
Although National Highways missed its RIS2 target, with 74.1% of closures accurately notified seven days in advance at the end of the road period, the company has significantly improved the timeliness and accuracy of roadworks information since the start of RP2, as shown in Figure 2.2.
Figure 2.2 Roadworks timeliness and accuracy KPI, annual data, April 2020 to March 2025
In addition, National Highways’ data shows that it improved performance against this KPI in all of its regions during RP2. Four of its six regions achieved accuracy rates of 75% in the final year of RP2. The company should continue to learn lessons from the best performing regions to ensure that it drives further improvements in the interim period and beyond.