This chapter sets out how National Highways delivered efficiency in the second road period (RP2, 2020 to 2025), as measured by the efficiency key performance indicator (KPI), and the company’s financial performance.
Efficiency
National Highways met its second road investment strategy (RIS2, 2020 to 2025) target to achieve £2.0 billion of efficiencies in RP2. The company’s reported efficiency is supported by sufficient evidence of efficient delivery, and in response to ORR challenge, its reporting has matured in several areas. Overall, less efficiency was delivered in RP2 than originally anticipated. However, this reflects changes to RIS2 programme, and its funding, that meant the efficiency target was reduced.
National Highways reported £2.2 billion of efficiency improvements against its target of £2.0 billion. The company made the largest efficiency improvements in renewals (£764 million) and the operating costs of its business (£538 million).
During RP2, ORR highlighted concerns about National Highways’ forecasting of efficiency, supporting evidence and management of risks to efficient delivery. The company responded positively and made improvements in these areas that it should build on in future road periods.
Government made changes to RIS2 outputs during RP2 that reduced National Highways’ funding. This was in response to a period of high inflation, delays to achieving planning consent for enhancements schemes, smart motorway programme changes and wider cost pressures on public funds. As a result, government reduced the efficiency target three times during RP2, following reviews by ORR to assess the company’s proposed changes.
National Highways has incorporated inflation and other adjustments to the way efficiency is reported to account for cost increases outside its control. We have worked closely with the company to ensure these ‘headwind’ adjustments are reported appropriately, alongside our core role of monitoring and reviewing evidence for its reported efficiency.
The following sections describe the efficiency KPI and how it has changed, National Highways’ reported efficiency and our assessment of its efficiency evidence.
KPI total efficiency
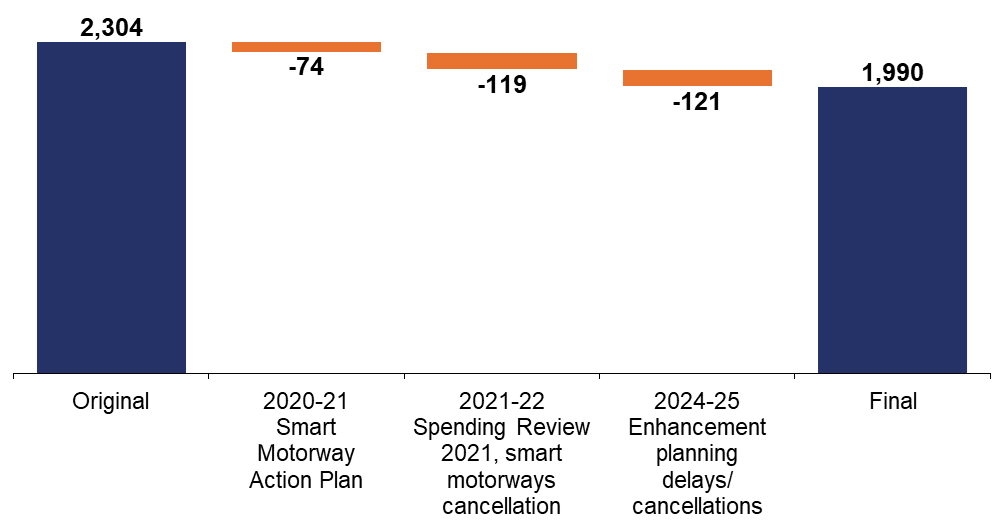
When RIS2 was set, National Highways had an efficiency target of £2.304 billion. Changes during the road period led to this target being reduced to £1.99 billion. The changes shown in Figure 5.1 related to smart motorway safety improvements and ceasing of further rollout; and planning delays to, and cancellation of, enhancement schemes. ORR closely scrutinised the proposed changes and advised government on their validity as part of our role in the formal change control process.
Figure 5.1 Changes to the Efficiency KPI target during RP2, (£ million)
National Highways’ reported efficiency over RP2
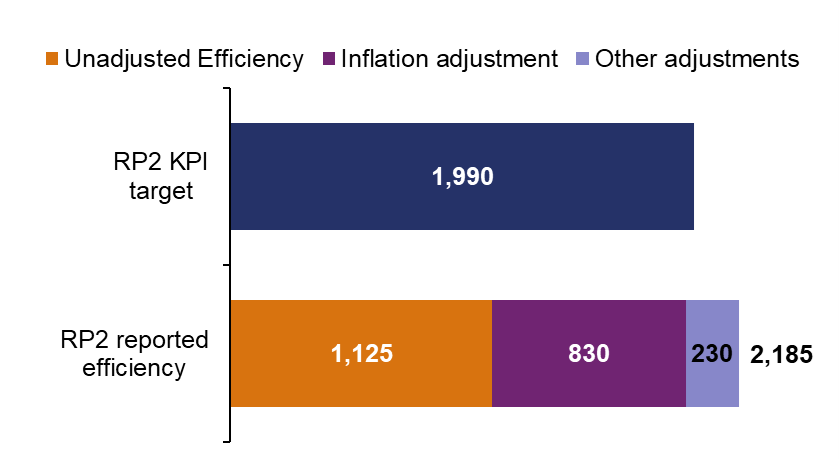
Figure 5.2 shows National Highways’ reported cumulative efficiency of £2,185 million during RP2. This includes adjustments for the impact of higher than funded inflation and changes to non-recoverable VAT that increased the company’s costs. The total reported efficiency also accounts for the company delivering more renewals output and pavement depth than planned, offset by delivering fewer outputs in non-roads capital expenditure (for example, in its estates programme). This is captured under ‘other adjustments’ in Figure 5.2.
Figure 5.2 Reported cumulative efficiency against the KPI, (£ million)
National Highways’ target is split between:
- embedded efficiency, where efficiency was ‘baked in’ to RIS2 plans through reduced funding; and
- measured efficiency, including:
– the carryover of the RP2 element of efficiency delivered in RP1; and
– RP2 generated efficiency where funding is not reduced but the efficiency reduces cost in future road periods.
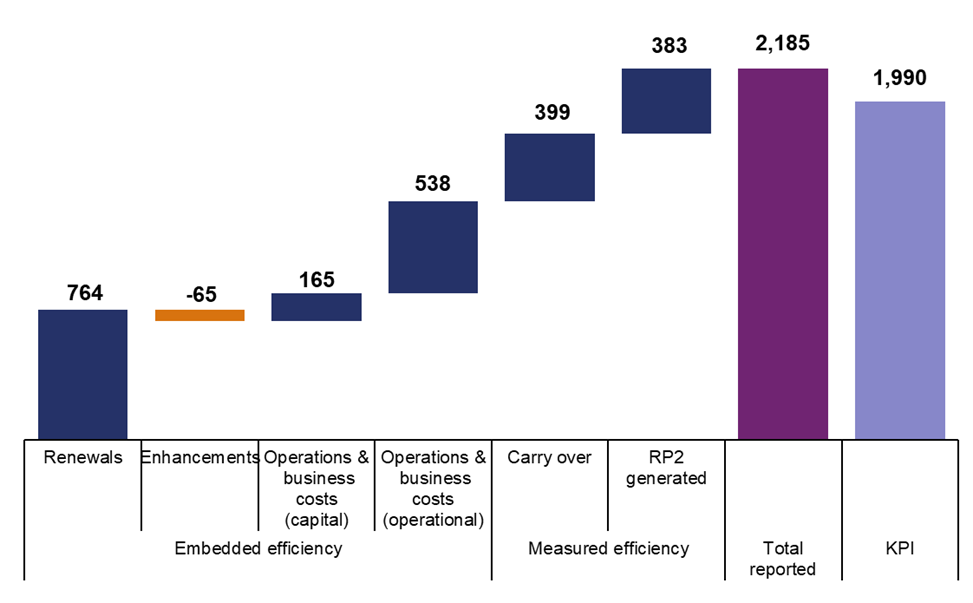
National Highways reported that it delivered broadly in line with its planned embedded efficiency (after adjustments) and delivered more than expected RP2 generated efficiency on larger enhancement schemes in development and initiatives to reduce whole life costs.
National Highways delivered less embedded efficiency on enhancements in part due to delivery challenges on some schemes within the company’s control. However, the company outperformed against its efficiency plans on operations, business costs and renewals. This was in part due to funding being diverted from enhancements that resulted in more opportunities to deliver efficiencies.
Figure 5.3 Reported cumulative efficiency by type, (£ million)
ORR role in assessment of efficiency evidence
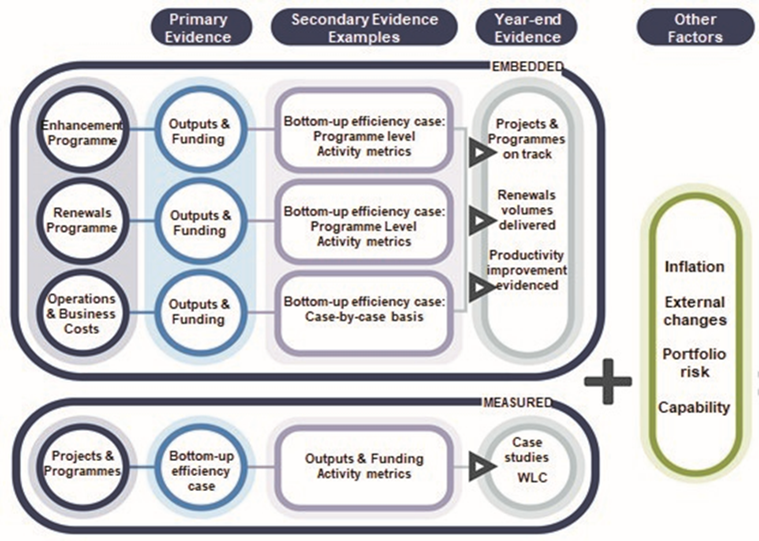
One of our primary functions as set out in legislation is to promote efficiency. It is therefore important that we scrutinise the quality of evidence that National Highways provides to demonstrate efficient delivery and that it is delivering true savings for taxpayers. Figure 5.4 shows the different types of efficiency and the supporting primary and secondary evidence that the company presents to support the reported values. The company’s Efficiency and Inflation Monitoring Manual provides definitions of types of efficiency used in this chapter.
Figure 5.4 Sources of evidence for types of efficiency by expenditure category
Assessment of cumulative efficiency evidence across RP2
Tables 5.1 and 5.2 show how National Highways’ reported cumulative efficiency is broken down against different categories. They also present ORR’s assessment of the evidence supporting each category, on which we provide more detail below.
Table 5.1 Embedded efficiency reported and our assessment of supporting evidence
| Embedded efficiency | Reported cumulative (£1,402 million) | Primary: outputs and funding | Secondary: activity metrics | Secondary: case studies |
|---|---|---|---|---|
| Enhancements | £-65 million | Good evidence | Good evidence | Good evidence |
| Renewals | £764 million | Good evidence | Good evidence | Good evidence |
| Operations and business costs (capital) | £165 million | Good evidence | Not available | Good evidence |
| Operations and business costs (operational) | £538 million | Good evidence | Not available | Good evidence |
Table 5.2 Measured efficiency reported and our assessment of supporting evidence
| Measured efficiency | Reported cumulative (£782 million) | Primary: case studies | Secondary: outputs and funding | Secondary: activity metrics |
|---|---|---|---|---|
| Carry over | £399 million | Good evidence | Not applicable | Not applicable |
| RP2 generated | £383 million | Good evidence | Not applicable | Developing evidence |
ORR view of efficiency evidence – outputs for funding
National Highways, in response to feedback on efficiency adjustments and forecasts from ORR during RP2, has improved its primary evidence for embedded efficiency on enhancements. We consider the adjustments it has made for inflation and non-recoverable VAT are appropriate and, overall, there is good evidence for the reported efficiency.
During RP2, National Highways’ renewals programme changed to accommodate evolving needs on the network. We required the company to develop its reporting to ensure it can show that it is still being efficient when it delivers differently to its original plans. This includes:
- where it has over or under delivered originally planned outputs for key assets; and
- the depth of its asphalt pavement renewals, as this affects longevity and cost.
National Highways’ reporting now appropriately reflects delivery at different levels than planned on key assets and greater asphalt pavement depth than assumed. There is good evidence for the reported efficiency following this adjustment and inflation which the company should continue to roll out across its portfolio.
For capital spending on operations and business costs, National Highways reduced the reported efficiency because it did not deliver all the funded outputs (due to delay in its estates programme) in the road period. There is good evidence for the reported efficiency recognising this adjustment and an adjustment for inflation.
Our monitoring shows efficiency delivery in National Highways’ operational spending on operations and business costs includes maintenance and privately financed projects. Outside of these areas, outputs are less defined and measurable for efficiency purposes. However, on balance, we consider there is good evidence for reported efficiency after applying the efficiency adjustment for inflation for this area of spend.
National Highways provided financial data for the Tier 1 enhancement schemes that were included in the measured RP2 generated efficiency category as a form of secondary evidence. In the final year of RP2 the cost baseline for these schemes was updated to reflect the latest RP2 forecast position. Therefore, as the baseline was updated to reflect the latest forecast, financial performance against this baseline would not reflect efficiency over RP2 and is not applicable for evidence purposes.
ORR view of efficiency evidence – activity metrics
A key piece of secondary evidence is activity metrics, where the cost of a specific unit of activity can be compared over time.
National Highways’ activity metrics secondary evidence for enhancements has increased in scope during the road period to now cover all lane running smart motorways, bypass and widening schemes and major junctions. At the end of RP2 this provided good supporting evidence for reported efficiency.
National Highways’ use of activity metrics to provide renewals efficiency supporting evidence has also increased during the road period and indicates that it is delivering efficiency at a similar scale to the level shown in primary evidence.
During the road period, National Highways explored with us options for activity metrics to be utilised as secondary evidence for both operational and capital operations and business costs. While the company is open to developing more metrics in the future, in RP2 it deemed the metrics unsuitable in these areas. This was due to the diversity of activity and complexities in correlating the potential metrics with efficiency performance. We welcome the engagement the company displayed in exploring these options and its openness to developing these metrics in future road periods. It is important that it considers the strength of efficiency evidence as a whole for an expenditure category and ensures that when one type of evidence is not available or weak, this is compensated for by greater depth/strength in other types of efficiency evidence.
National Highways undertook some high level analysis of the IP5 Maintenance Delivery Performance Monitoring Statement, which reports outputs, to understand general trends in activity and cost. Whilst not formally reported as an activity metric this analysis helped to show efficiency, as the number of reactive outputs has increased while maintenance spend has remained flat over RP2.
Throughout RP2 we encouraged National Highways to develop secondary evidence to support the primary evidence (efficiency case studies) for RP2 generated measured efficiency. During the road period the company undertook a pilot to explore how existing activity metrics could be applied to the enhancement schemes that fall within this category. This was successful and has been utilised to demonstrate efficiency on two of the schemes. For both schemes the activity metrics supported the reported value from primary evidence. This is a promising developing area of efficiency evidence that should be extended and further utilised in the interim period and beyond.
ORR view of efficiency evidence – efficiency case studies
National Highways reported 139 efficiency case studies across RP2. Case studies are narrative descriptions of efficiency initiatives and their financial benefits. These case studies represent the gross value of a wide range of efficiency initiatives delivered by the company in RP2.
In most instances, the value of embedded secondary case study evidence represented at least 90% of the reported primary embedded efficiency. However, for renewals the final value of case studies provided less support of the primary reported efficiency, with 71% coverage of the reported efficiency (84% coverage of the renewals milestone ‘target’ efficiency). While coverage of the primary reported efficiency is lower for renewals than other categories the renewals efficiency value includes significant adjustments for delivery beyond the plan, for example deeper pavement renewal depths. It is important that the company continue to develop in future sufficient secondary evidence to support its reported efficiencies and demonstrate value for money for taxpayers.
National Highways also reported case studies as primary evidence for RP2 generated measured efficiency. The value of these case studies was in line with the reported efficiency showing good evidence of the types of efficiency generated. Given that for measured efficiency case studies are the primary source of evidence it is important that the company continues to make improvements in quality to these case studies to ensure a clear, concise record of the initiatives delivered.
Throughout RP2, some efficiency case studies were reported with the value realised to date and a forecast value for the whole road period. In the final year of RP2 we challenged National Highways around the accuracy of these forecast values. The company undertook an exercise to review and update the forecast efficiency values where appropriate, sharing relevant supporting evidence with us to assess the revised values. This ensured the reported efficiency was an actual rather than a forecast value.
National Highways’ £399 million of carry over efficiency is from projects and programmes that commenced in the first road period (RP1, 2025 to 2020), with expenditure that spans both RP1 and RP2. This is supported by case studies that we reviewed during RP1. The carry over efficiency includes £39 million relating to schemes that were cancelled during the road period. This includes both efficiencies that were and were not realised prior to the schemes’ cancellations. While strictly speaking the element that had not been realised should be removed from the efficiency reported by the company, the target should also be reduced by the same amount to reflect the cancellations. Therefore, including the full £39 million does not impact our conclusion or National Highways’ delivery of its target.
Similarly, the reported value and KPI target include efficiency relating to the schemes cancelled following the 2025 Spending Review, some of which likely will, and some likely will not, have been realised before the cancellations. For the same reasons as above, this does not affect our conclusions or National Highways achieving its target.
Other factors
ORR worked closely with National Highways throughout the road period to improve the way it reports and provides evidence for efficiency. This is a complex area and the impact of external factors and change to the road investment strategy (RIS) has required close engagement to ensure we can provide confidence to government in the company’s reported efficiency.
As discussed above, for several expenditure categories the reported embedded efficiency based on delivering outputs for post efficient funding was adjusted to reach a final reported value. These adjustments reflected costs outside National Highways’ control for inflation differing from the funded level and non-recoverable VAT affecting enhancements and, to a small extent, renewals. There were also efficiency adjustments for the over/under delivery of renewal outputs, including related to the depth of pavement renewals, and for under delivery of capital operations and business costs.
During RP2, we commissioned a review of how National Highways had used its central risk reserve (CRR) and the implications for how the company reports, and we scrutinise, its efficiency. The company now reports annually on how its use of CRR impacts its reported efficiency. This provides greater transparency for our monitoring.
National Highways’ efficiency evidence includes descriptions of key capability building change programmes (controlled through its wider Transformation Programme) used to support delivery of efficiency improvements during RP2. These support the company’s overall efficiency case and describe how it has developed during RP2 to deliver its programme of efficiency. It is important that the company monitors and can demonstrate the impact and value for money of its business improvement programme through the interim period and during RP3.It is important that the company monitors and can demonstrate the impact and value for money of its business improvement programme through the interim period and during RP3.
Forward look
The 2025 to 2026 Interim Settlement requires National Highways to demonstrate efficiency through its performance reporting to ORR. This single year commitment recognises that step changes in efficiency are normally achieved over a longer period, so government determined it would not be appropriate to set a KPI target for a single year. However, it is still important that the company continues to evidence that it is efficient and effectively spending public money.
We worked with National Highways early in 2025 to agree principles for efficiency reporting and monitoring in the interim period. These were agreed in June 2025 and are described at a high level in the Operational Metric Manual. The principles are based on established practice from RP1 and RP2 but place greater emphasis on activity metrics to demonstrate efficient delivery.
Conclusion
National Highways’ efficiency evidence taken as a whole is sufficient to demonstrate delivery of its efficiency KPI. The lower level of efficiency delivered in RP2 than was originally anticipated in the RIS reflects the funding changes to the RIS. We are satisfied that the agreed revisions to the KPI were appropriate and that (at least) the same level of efficiency challenge for the company was maintained.
The adjustments that National Highways made to reported efficiency (taken directly from its financial reporting) to recognise the impact of external factors, have been significant to its final position. We have focused our work with the company to ensure that these adjustments are appropriate and robust. The approach to inflation adjustments in RP2 builds significantly on that taken in RP1.
The improvements National Highways made to how it evidences efficiency will have value in future road periods and should enable greater confidence and transparency for funders and road users.
As described above we expect activity metrics to have a greater role within efficiency frameworks in future. We will also work with National Highways to identify how the efficiency case studies process could be improved to reduce reporting and regulatory burden.
Financial Performance
This section discusses changes to National Highways’ RIS2 funding, the company’s expenditure during RP2, its forecast enhancements total outturn expenditure and use of the CRR.
There have been several significant external impacts on National Highways’ spending and funding during RP2: a period of high inflation, delays to planning consent for enhancement schemes and government changes to the enhancements programme. The impact on the company’s financial performance is discussed below.
Funding changes throughout RIS2
National Highways’ RIS2 funding was subject to change at several points throughout RP2. Figure 5.5 compares the funding as outlined in the original 2020-2025 delivery plan, a total of £27,358 million compared with the funding presented in the final 2024-2025 delivery plan update, a total of £23,042 million.
Figure 5.5 Change in RIS2 funding from the start of RP2, (£ million)
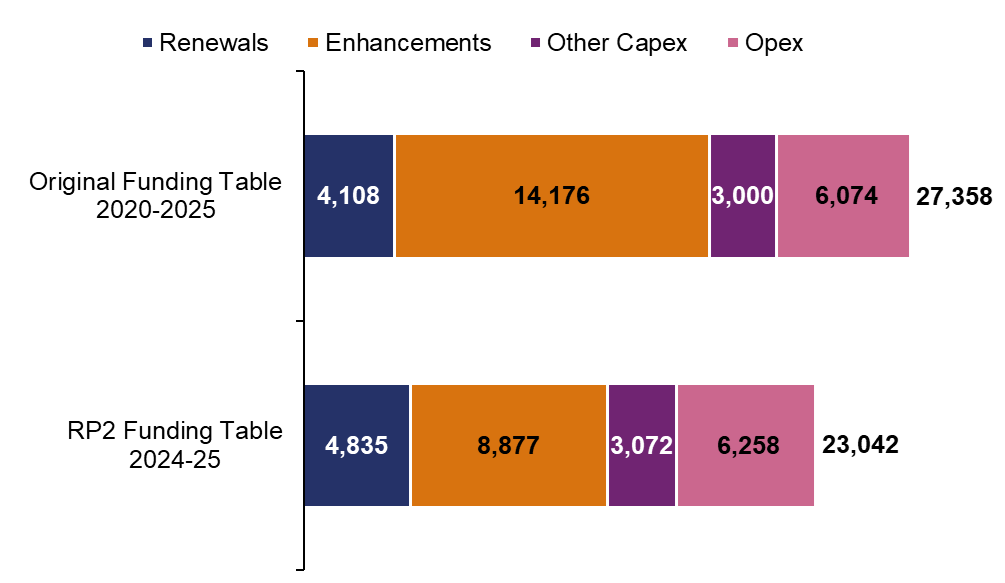
There were two significant reductions in capital funding during RP2. The 2021 Spending Review reduced National Highways’ funding by £3,428 million because of changes to 12 schemes with known or predicted schedule delays due to statutory planning or local stakeholder challenges. The 2024-2025 delivery plan update confirmed a further reduction of £1,067 million for similar issues and the cancellation of some lower value for money schemes to ensure future RISs were affordable given wider government cost challenges.
National Highways increased its funding for renewals by making use of some CRR funding originally earmarked for enhancements. Smaller capital funding changes related to additional funding in year 1 of RP2 to accelerate works on the A66 Northern Trans-Pennine (£146 million) and a year 4 of RP2 transfer to operational expenditure (£100 million).
National Highways also met a government request to reduce its capital spending by £50 million in the final year of RP2 and reported that it was asked to deliver £15 million of unfunded activity, due to constraints on public spending.
Across RP2, National Highways operated with constrained budgets for operational expenditure as it was required to cover costs outside of its control and requests for additional work by government. The company received additional funding of £50 million in the final year of RP2 from government to cover inflationary pressures, support Operation Brock (traffic management on the M20 to facilitate channel crossings from Dover) and close out costs for cancelled schemes.
Expenditure
National Highways spent £23,252 million during RP2, broken down to £16,811 million of capital expenditure and £6,441 million of resource expenditure. This included £235 million on non RIS activity and £23,020 million delivering RIS2. Government provided £23,042 million funding for RIS2 which included £6,258 million for resource expenditure and £16,785 million for capital expenditure. The company spent within its overall RIS funding and its resource and capital allocations in delivering the RIS.
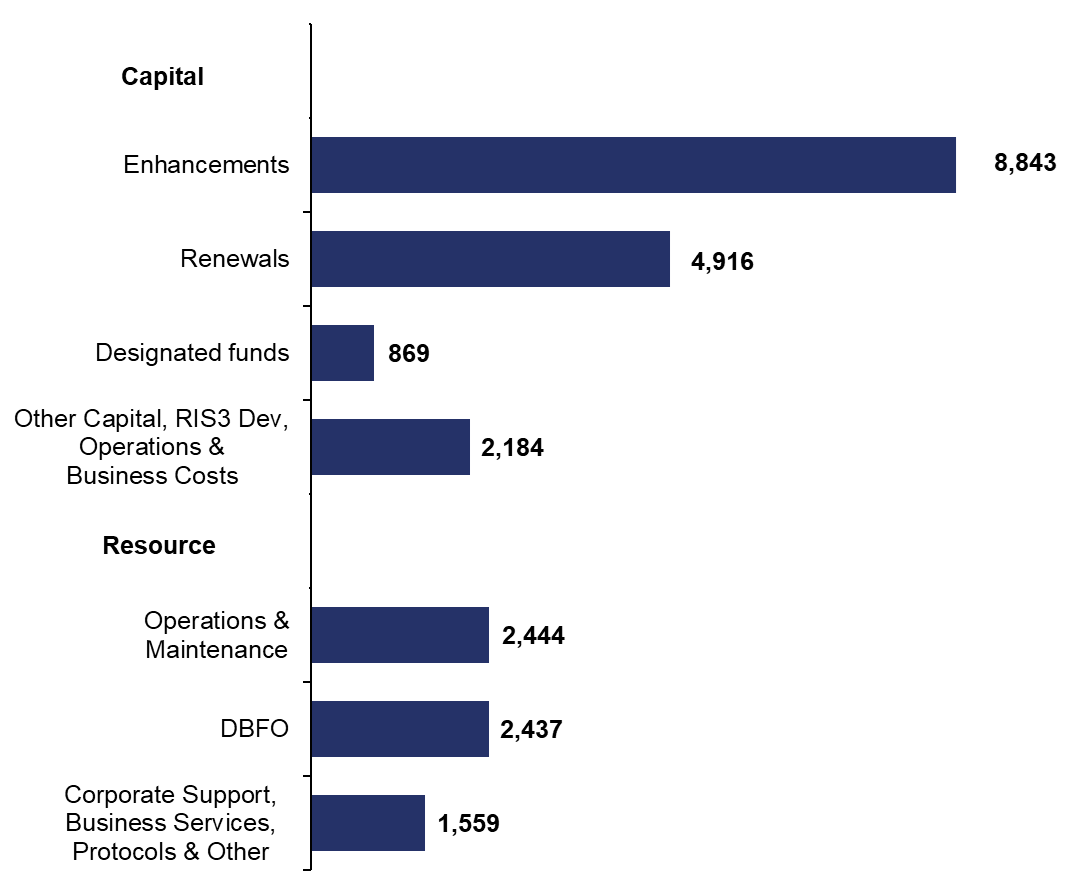
Figure 5.6 shows the expenditure across both capital and resource since the start of RP2 broken down by categories of spend. This shows how the largest proportion of spend relates to the delivery of capital enhancements and renewals.
Figure 5.6 Total expenditure since the start of RP2 by category, (£ million)
Capital expenditure in RP2
National Highways’ total spending on capital was broadly in line with its final funding. However, the amount and profile differed significantly from the original plans for RIS2 because of the funding reductions during RP2 discussed above. Figure 5.7 shows how the company’s spending compares to initial baseline funding plans.
Figure 5.7 Capital expenditure in RP2 compared to year 1 of RP2 baseline assumptions, (£ million)
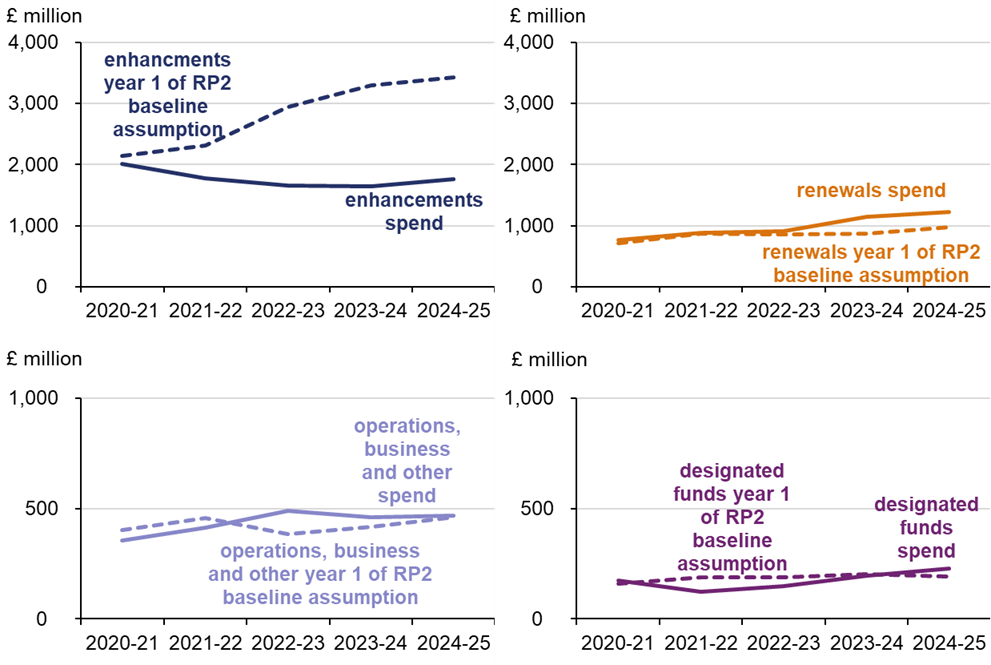
National Highways spent £8,843 million on enhancements during RP2, closely aligned with the final, revised funding of £8,877 million. This was the largest category of spend. This spend was relatively evenly spread across the five years of the road period.
Scheme delays throughout RP2 resulted in spend against enhancements being much lower than expected against the original baseline as seen in Figure 5.7, especially towards the end of the road period. Further detail on enhancements delivery performance is in the Enhancements delivery chapter.
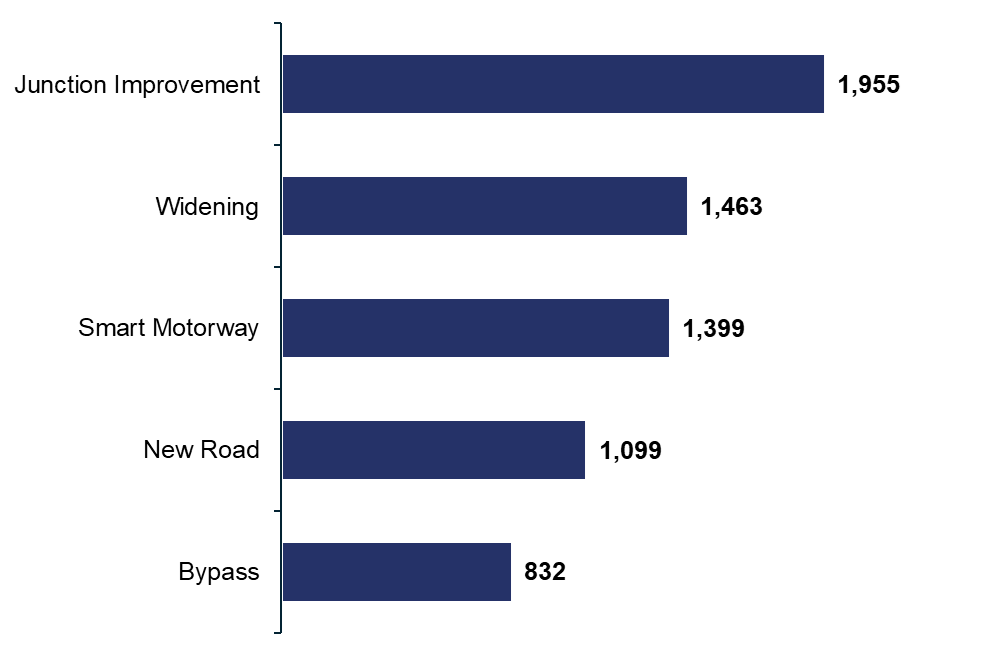
Figure 5.8 shows a split of spend in RP2 across the 49 delivery plan enhancement schemes, excluding cancelled schemes, by project type. The largest proportion of spend related to junction improvement schemes, although this category also represents the largest number of schemes. Of the five different project types, four spent over £1,000 million across the road period.
Figure 5.8 Spend by project type, excluding cancelled schemes, (£ million)
National Highways spent £4,916 million on renewals during RP2, slightly above the final, revised RP2 funding of £4,835 million. The company delivered higher than expected volumes of most asset types. However, it fell short of the target for two key asset types, concrete pavement and concrete safety barriers. Delay to enhancement schemes in the road period also resulted in the company repurposing some funding for renewals activity. Further detail on renewals delivery performance can be seen in the Operations, maintenance and renewals chapter.
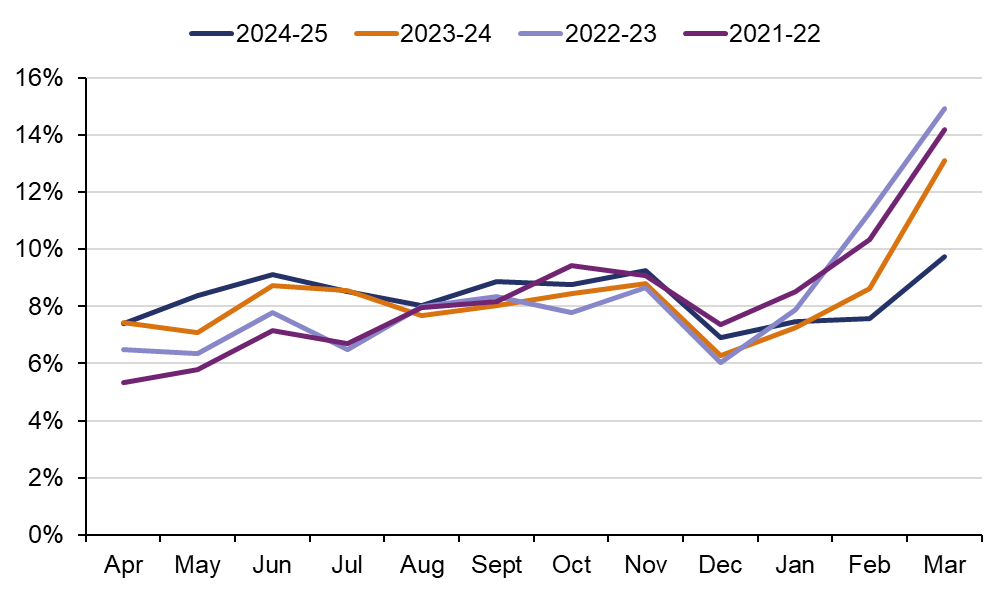
Figure 5.9 shows how the annual profile of renewals delivery. Spend was often higher in the later months of the year. This can be considered inefficient. Schemes delivered at the end of the year are more affected by cold and/or wet weather, limiting the working time available and requiring more shifts to deliver the same volume of work. Also, many materials are susceptible to cold and wet weather that can limit their lifespan when the renewal is carried out at the end of the year. Figure 5.9 shows how this profile improved in year 5 to be generally flatter across the financial year. The company should aim to continue this trend delivering a more sustainable profile in the interim period and beyond.
Figure 5.9 Profile of renewals spend across RP2, (%)
National Highways spent £869 million across four designated fund (DF) categories during RP2, in line with the final funding. The company spent:
- £422 million on Environment and Wellbeing;
- £157 million on Innovation and Modernisation;
- £147 million on Safety and Congestion; and
- £143 million on Users and Communities.
Expenditure generally increased each year of the road period and in year 5 National Highways delivered its highest ever expenditure on DF of £227 million. Positively, this ramp up of activity ensured that the company utilised all of its DF funding in RP2. The company needs to ensure that it continues to have robust plans in place so that it is effectively and efficiently using these funds to deliver benefit and support its wider delivery commitments. It should also improve how it captures and reports data on the successful delivery of DF schemes for which funding has been allocated.
Capital expenditure forecast total outturn for enhancements
The total outturn forecast for an enhancement scheme is the total cost expected to completion. National Highways reported to us the forecast total outturn costs for each of the named delivery plan schemes across RP2.
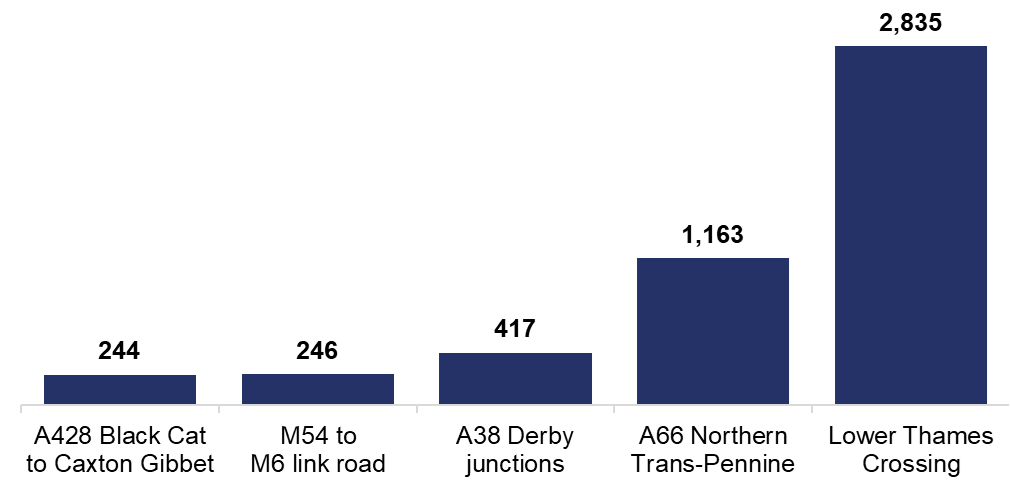
Figure 5.10 shows the five enhancement schemes that had an increase in total outturn forecast of greater than £200 million since the start of RP2. This was calculated by comparing the forecasts produced at March 2025 and June 2020. The largest increase relates to the Lower Thames Crossing scheme where the forecast increased by £2,835 million driven primarily by delays in approval of the scheme. As noted in section 3, National Highways should continue to implement, embed and monitor the effects of the actions it has identified to continuously improve its estimating and cost control.
Figure 5.10 Largest increases to total outturn forecast since the start of RP2, (£ million)
Operational expenditure
National Highways’ operational expenditure across RP2 was higher than originally expected in the plans for the RIS because of the impact of inflation and additional activity requested by DfT during the road period. Figure 5.11 shows that this mainly impacted the company’s Design Build Finance and Operate (DBFO) contracts and ‘other expenditure’ on corporate support, business services, and protocols.
Figure 5.11 Operational Expenditure in RP2 compared to year 1 of RP2 baseline assumptions, (£ million)
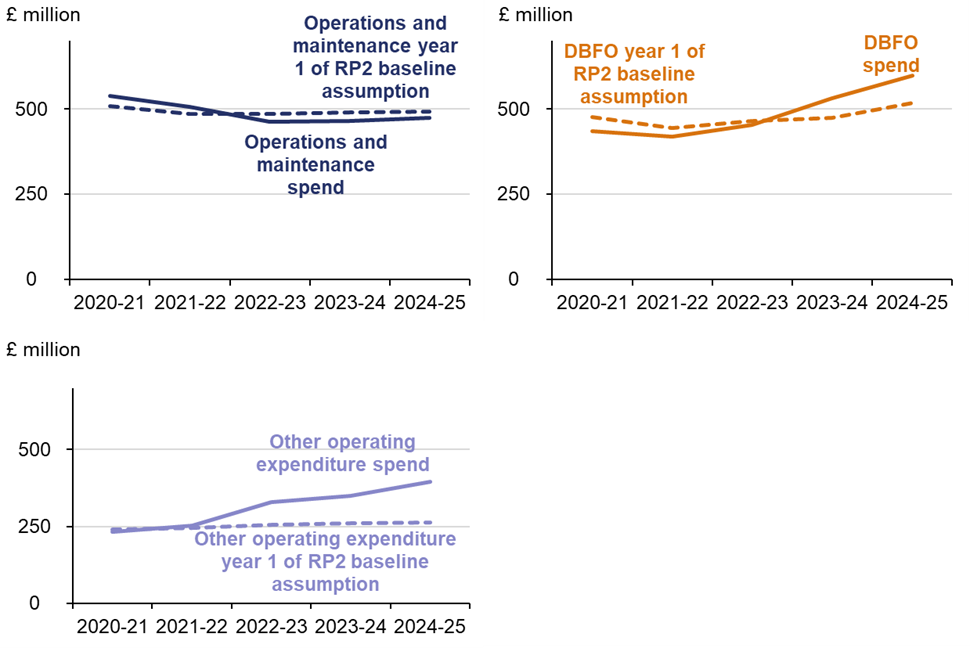
National Highways spent £2,444 million on operations and maintenance during RP2. During RP2 operations and maintenance activity was impacted by several cost pressures, including higher than expected inflation, increased incidents on the network, and maintenance backlogs. Operational costs were affected during RP2 by recruitment delays, higher than expected third party income (or ‘green claims’) in some years and damage to network property costs being capitalised, which reduced operational pressure. Further details on operations and maintenance delivery performance can be found in the Operations, maintenance and renewals chapter.
National Highways spent £2,437 million on its DBFO contracts. Figure 5.11 demonstrates that the company spent a smaller proportion of the budget at the beginning of RP2. This was due to external factors such as the pandemic that reduced traffic volumes during the early years of RP2 and therefore led to lower service charges. Further savings were also identified through contract reviews and adjustments to repayments.
Corporate support, business services, and protocols combined spend was £1,559 million across RP2. Expenditure in these categories increased over the period. A significant portion of this was driven by Operation Brock and close out costs for cancelled schemes in year 5, although National Highways received additional funding to help cover this.
Central risk reserve
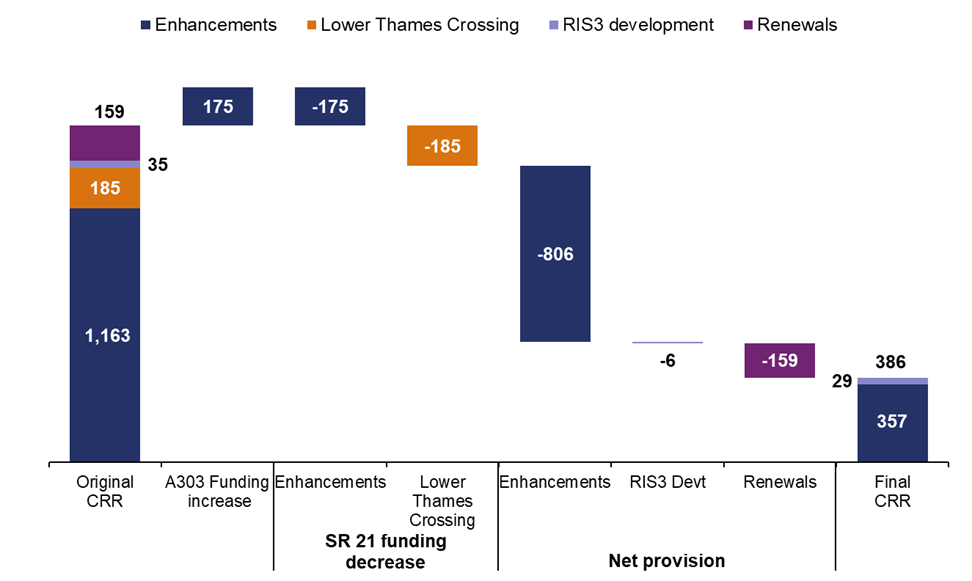
Figure 5.12 shows how the CRR value varied alongside changes to enhancements funding. Following the 2021 Spending Review, the CRR was reset to £1,357 million with the removal of a specific CRR allocation for the Lower Thames Crossing scheme.
Enhancements schemes and other enhancements budgets received a net £806 million from the CRR. However, this included the CRR receiving funds back from some schemes with underspends in RP2 because of delays. The renewals programme received £159 million and RIS3 development schemes received £6 million.
There was £386 million of the CRR unallocated at the end of RP2. However, this fully offset remaining cost pressures on capital budgets, meaning that National Highways spent in line with its RIS2 capital funding.
Figure 5.12 Use of Central Risk Reserve (CRR) during RP2, (£ million)