Financial performance
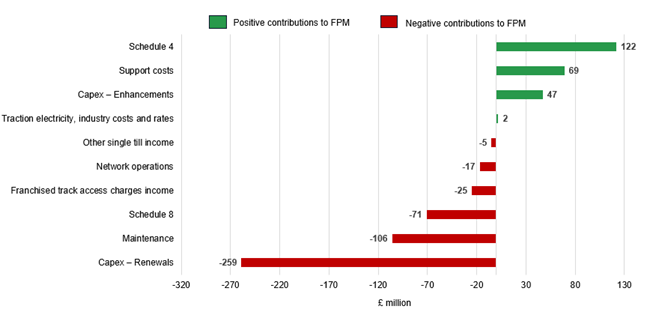
2.1 Due to financial pressures in the year, Network Rail reported a £243 million underperformance against its CP7 delivery plan. This means, net of income, Network Rail spent £243 million more than originally planned. Figure 2.1 illustrates the factors contributing to Network Rail’s underperformance in the year.
Figure 2.1: Contributions to Network Rail’s financial underperformance in April 2024 to March 2025
Source: ORR analysis of Network Rail data
Table 2.1: Network Rail’s financial performance, Great Britain, April 2024 to March 2025
| £ million, cash prices | Actual | CP7 delivery plan | Variance | FPM out / (under) performance | % of FPM contribution |
|---|---|---|---|---|---|
| Network grant income | 7,607 | 7,807 | (200) | - | - |
| Franchised track access charges | 3,358 | 3,394 | (36) | (25) | (10%) |
| Other single till income | 759 | 762 | (3) | (5) | (2%) |
| Total income | 11,724 | 11,963 | (239) | (30) | (12%) |
| Network operations | 892 | 875 | (17) | (17) | (7%) |
| Support costs | 1,099 | 1,210 | 111 | 69 | 28% |
| Traction electricity, industry costs and rates | 1,322 | 1,354 | 32 | 2 | 1% |
| Maintenance | 2,504 | 2,373 | (131) | (106) | (44%) |
| Schedule 4 | 270 | 395 | 125 | 122 | 50% |
| Schedule 8 | 118 | 47 | (71) | (71) | (29%) |
| Total operating expenditure | 6,205 | 6,254 | 49 | (1) | (0%) |
| Capex – Renewals | 3,683 | 4,010 | 327 | (259) | (107%) |
| Capex – Enhancements | 2,084 | 2,194 | 110 | 47 | 19% |
| Total capital expenditure | 5,767 | 6,204 | 437 | (212) | (87%) |
| Risk expenditure | - | 31 | 31 | - | - |
| Financing costs and other | 2,498 | 2,687 | 189 | - | - |
| Total expenditure | 14,470 | 15,176 | 706 | (213) | (88%) |
| Financial performance measure (FPM) | - | - | - | (243) | (100%) |
Source: ORR analysis of Network Rail’s data. Numbers may not sum due to rounding. Note that total income does not equal total expenditure, this is because of the timing of recognition of income and expenditure (particularly in relation to financing costs) as explained in Network Rail’s regulatory financial statements.
2.2 Table 2.1 shows Network Rail’s actual performance against its budgeted income and expenditure, set out in its CP7 delivery plan. The table also shows FPM for each budget line, which indicates how much Network Rail has out/underperformed taking account of what it was expected to deliver.
2.3 Network Rail’s financial underperformance in April 2024 to March 2025 was driven primarily by renewals, where delays and delivery issues, including inflationary cost increases, led to significant underperformance. Additional maintenance activity and higher payments under the financial performance incentive regime (Schedule 8) to train operators also contributed.
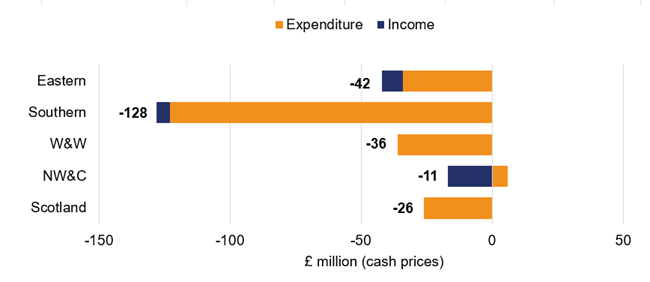
2.4 Figure 2.2 shows the contributions of Network Rail’s five regions to the company’s financial underperformance.
Figure 2.2: Regional contributions to Network Rail’s financial underperformance, April 2024 to March 2025
Source: ORR analysis of Network Rail’s data
Expenditure
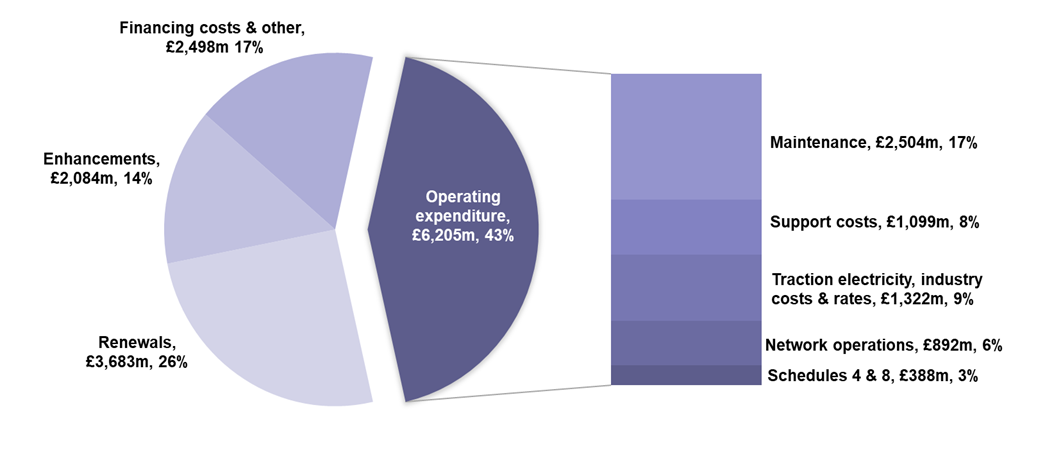
2.5 Network Rail spent £14.5 billion from April 2024 to March 2025, a 5% year on year decrease (£15.2 billion previously) Figure 2.3 shows the main categories of Network Rail’s expenditure.
Figure 2.3: Network Rail’s expenditure from April 2024 to March 2025
Source: ORR analysis of Network Rail’s data
Operating expenditure
2.6 Operating expenditure relates to maintenance activities, network operations, support costs, traction electricity, industry costs and rates, and the Schedule 4 and 8 regimes. These expenditure items are examined below.
Maintenance
2.7 Maintenance expenditure relates to activities that maintain the condition and capability of the existing infrastructure to the previously assessed standard of performance. Network Rail spent £2,504 million maintaining its network in April 2024 to March 2025, underperforming by £106 million. The overspend was a result of additional works undertaken on the network including higher than expected reactive maintenance activities, recruitment costs and training delays reducing the expected benefits of the maintenance modernisation programme. Additionally, pay awards for front line staff were higher than CPI inflation.
Network operations
2.8 Network operations expenditure relates to activities such as signalling and operating Network Rail’s managed stations. Network Rail spent £892 million operating the network in April 2024 to March 2025, with a £17 million underperformance. This was primarily due to the pay awards previously outlined, as well as additional recruitment to improve resilience, reducing reliance on overtime and replenishing the workforce.
Support costs
2.9 Support costs relate to activities that facilitate Network Rail’s core business activities including corporate functions and IT services. Support costs were £1,099 million in the year, with an outperformance of £69 million. The financial outperformance was driven by a higher proportion of project support expenditure being treated as capital investment, and savings across a number of areas such as Route Services – Digital Data & Technology, Insurance, System Operator and regionally-managed activities.
Traction electricity, industry costs and rates
2.10 Network Rail purchases electricity to provide power for electrically powered trains, and for its own usage. The traction electricity costs are largely matched by an equal amount of income from train operators. Industry rates and other costs include Network Rail’s share of British Transport Police costs, business rates, Rail Safety and Standards Board (RSSB) costs, the ORR licence fee, and railway safety levy. Network Rail has limited control over these costs, which are either set by government agencies, or are driven by train operator usage and market prices in the case of traction electricity costs.
2.11 These items are largely passthrough costs which do not contribute to Network Rail’s financial performance.
Schedule 4 and Schedule 8
2.12 The Schedule 4 regime compensates train operators for planned reductions to network availability. It incentivises Network Rail to plan engineering work early and efficiently to reduce disruption. The Schedule 8 performance regime compensates train operators or Network Rail for the impact of unplanned service disruption.
2.13 Schedule 4 costs were £270 million, with an outperformance of £122 million. Network Rail’s delivery plan included performance risk contingencies for planned engineering disruptions, which were largely offset by higher Schedule 8 costs (see below). Schedule 4 outperformance was mainly a result of more productive engineering possessions during the year including, better coordination, improved planning, and optimised use of resources, which reduced disruption. Additionally, there were fewer impactful weather events, which further contributed to the cost savings.
2.14 However, Schedule 8 costs were £118 million, with an underperformance of £71 million. This was driven by higher than forecast train cancellations, delays, trespassing and cable thefts.
Renewals
2.15 Renewals expenditure relates to activities to replace (in whole, or in part) network assets that have deteriorated such that they can no longer be maintained economically. Renewal of an asset restores the original performance of the asset and can add additional functionality as technology improves.
2.16 Network Rail spent £3,683 million renewing the rail network in April 2024 to March 2025 with an underspend of £327 million against its CP7 delivery plan.
2.17 The underspend was driven by the reprioritisation of funding to other activities by regions and the reprofiling of signalling schemes across the control period, mainly the ETCS programme (which aims to replace traditional lineside signals with in-cab signalling to enhance safety, capacity, and reliability).
2.18 Network Rail invested less on its property portfolio in the year than expected. This was largely driven by the delay in establishing its new Platform 4 business which aims to consolidate and strengthen land and property development across the UK rail estate. Network Rail is aiming to achieve £1,615 million of property income in CP7, a 109% increase from CP6.
2.19 Alongside the underspend, Network Rail underperformed by £259 million on its renewals activities meaning that it spent more for what it delivered than planned. This was most notably in signalling activities (which accounted for 53% of the total renewals’ underperformance) where delivery issues across several major schemes resulted in project delays with associated additional costs.
Enhancements
2.20 Enhancements are changes to improve network capacity or capability, for example, enabling more train journeys or higher speeds. Enhancement schemes are subject to approvals on a case by case basis from the Department for Transport (DfT) and Transport Scotland (TS) under their ‘pipeline’ approaches for releasing funding as individual projects progress.
2.21 Network Rail spent £2,084 million on government-funded enhancements in April 2024 to March 2025. Expenditure on the main schemes is summarised in Table 2.2.
2.22 Overall financial performance on enhancements was strong, with a £47 million outperformance, with the largest contributions coming from the East West Rail programme (which was £40 million) and the TransPennine Route Upgrade (which was £29 million).
Table 2.2: Network Rail’s enhancements expenditure in April 2024 to March 2025
| £ million, cash prices | Actual | CP7 delivery plan | FPM out/ (under) performance |
|---|---|---|---|
| TransPennine Route Upgrade | 842 | 832 | 29 |
| East Coast Digital Programme (South) | 230 | 215 | 0 |
| Midland Main Line Programme | 101 | 119 | 9 |
| Access for All | 96 | 96 | 0 |
| Cambridge South Station | 87 | 87 | (4) |
| Northern Powerhouse Rail (NPR) | 62 | 88 | 0 |
| ECML Upgrades (IRP schemes) | 60 | 49 | 0 |
| East West Rail Programme | 57 | 110 | 40 |
| Wigan to Bolton Electrification | 50 | 47 | 1 |
| Other DFT funded schemes | 321 | 391 | (28) |
| Transport Scotland funded schemes | 154 | 160 | 0 |
| Other capital expenditure | 24 | 0 | 0 |
| Total Network Rail-funded enhancements | 2,084 | 2,194 | 47 |
| Third party-funded enhancements (including HS2) | 435 | - | - |
| Total enhancements | 2,519 | 2,194 | 47 |
Source: ORR analysis of Network Rail’s data. Numbers may not sum due to rounding.
Employment costs
2.23 In April 2024 to March 2025, Network Rail employed an average of 41,702 staff, a 1% annual increase (on a full time equivalent (FTE) basis). Total staff costs increased by 0.7% to £3.0 billion, representing 21% of the company’s annual expenditure.
2.24 Maintenance headcount reduced by 4% to around 14,241 FTEs during the year and reduced by around 9% compared to the end of Year 1 of CP6.
2.25 The average employment cost for a full-time employee (excluding agency staff) was £64,351, an annual increase of 0.2%, of which 25% was from overtime, allowances, performance related pay and employer pension contributions.
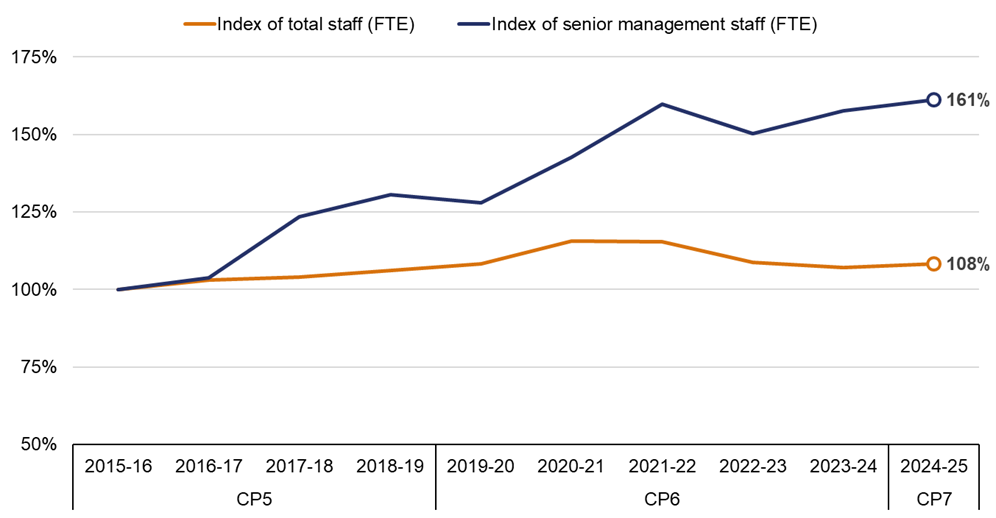
2.26 However, headcount in senior management grades (Director and Band 1 levels) increased by 2% during the year, continuing a longer-term trend that has seen senior management headcount increase by 26% over the last five years and by 61% over the last decade (see Figure 2.4). Including pensions, bonus and allowances the average total reward for these senior managers was £167,927, an increase of 5% from last year.
Figure 2.4: Change in total staff (FTE) and senior management (FTE) headcount, April 2015 to March 2025
Source: ORRanalysis of Network Rail’s data
2.27 The increase in senior management headcount and remuneration suggests a shift in workforce and cost management priorities. While the average cost per employee has only marginally increased, the proportionally higher growth in senior roles may indicate an opportunity to review the staffing strategy and cost efficiency opportunities.
2.28 Network Rail’s agency staff FTE reduced by 11% in the year to 755 people. This represents an 18% decrease from the end of Year 1 of CP6.
Efficiency
2.29 In determining the funding that Network Rail would need to deliver its required outputs in CP7 we assessed the efficient level of expenditure that it required. Network Rail is expected to deliver £3.9 billion of efficiency improvements in CP7 (in cash prices). The detailed assumptions regarding expenditure and efficiency that informed these forecasts are outlined in our PR23 determination.
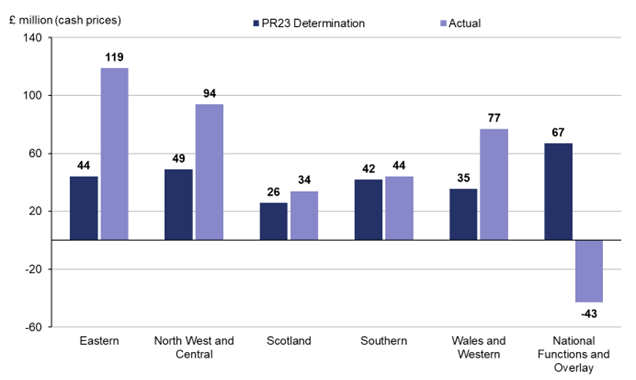
2.30 In the year April 2024 to March 2025 Network Rail delivered £325 million of efficiency improvements, 24% ahead of our PR23 target of £263 million.
2.31 We commissioned Nichols Group to undertake an independent assessment of Network Rail’s preparedness to deliver its efficiency plans in the first two years of CP7. Overall, Nichols’ assessment found Network Rail’s efficiency plans for Years 1 and 2 of CP7 were reasonable. Nichols suggested that Network Rail should look to overdeliver early in the control period to de-risk the achievement of the significantly more challenging efficiency targets for Years 3 to 5.
2.32 As shown in Figure 2.5, all five of Network Rail’s regions exceeded their Year 1 efficiency targets. The efficiencies delivered by a region are influenced by the nature of the planned work, the region's size, and its distinct geographical characteristics.
Figure 2.5: Regional contributions to efficiency improvements, from April 2024 to March 2025
Source: ORR analysis of Network Rail’s data
2.33 Network Rail’s Group Finance applied an overlay/reduction to total reported efficiency for some initiatives where internally reported amounts could not be fully validated. Network Rail’s range of reported Year 1 efficiency was £295 million to £352 million. More details on regional efficiencies can be found in Chapter 5.
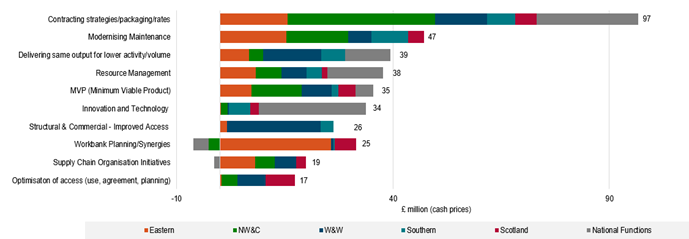
2.34 Network Rail achieved efficiency improvements in the first year of CP7 from a number of initiatives. The top ten initiatives are shown in Figure 2.6.
Figure 2.6: Top ten efficiency initiatives in April 2024 to March 2025
Source: ORR analysis of Network Rail’s data
2.34 The largest efficiency initiatives that Network Rail delivered in April 2024 to March 2025 were:
1. Contracting strategies / packaging / rates (£97 million)
Contracting strategies, packaging and rates focuses on commercial delivery methods, including negotiating contracts with improved terms or rates, enhancing market research and monitoring contracts more effectively. Network Rail states that it has enhanced collaboration between regions and the central supply chain organisation to consolidate duplicate contracts, strengthen supplier relations and share expert knowledge. Examples of efficiency savings are cost decreases associated with new contracting methods, packaging of works, and savings realised from competitive tendering for Network Rail’s framework contracts.
2. Modernising Maintenance (£47 million)
This includes a programme focused on reviewing and streamlining processes within Maintenance Delivery Units (MDUs), enabling these units to carry out their activities with more effective deployment of staff. Efficiencies are achieved through optimising rostering, setting correct team sizes for work and managing subcontractor usage, driven by the implementation of the Modernising Maintenance programme. This results in cost savings through enhanced productivity.
3. Delivering same output for lower activity/volume (£39 million)
This initiative involves Network Rail reviewing programme deliverables to identify opportunities to streamline processes, using automation, and enhancing performance by reducing volume or specification without affecting outcomes.
4. Resource Management (£38 million)
This initiative is part of Network Rail’s broader effort to improve workforce planning and deployment by using data, modernising team structures, and embedding efficiency into daily operations. For example, opportunities to reduce costs associated with the use of contractors such as moving them to permanent roles or the use of enforced leave over Christmas periods.
5. MVP (Minimum Viable Product) (£35 million)
This initiative focuses on delivering projects from the concept stage through to delivery, aiming to meet essential project objectives efficiently and cost effectively while satisfying minimum requirements.
6. Innovation and Technology (£34 million)
This efficiency grouping includes several initiatives aimed at modernising and improving the railway through the use of new technologies and smarter ways of working. This includes smarter engineering methods to extend asset life, better use of IT equipment, digital tools that help predict and prevent faults, and using lineside building wraps (LSB wraps) to upgrade structures instead of demolishing and rebuilding them.
7. Structural and Commercial – Improved Access (£26 million)
This efficiency initiative aims to reduce costs and boost efficiency by improving how track access is planned and used, and by streamlining commercial arrangements with suppliers. Efficiency is driven by improved access strategy, in collaboration with train operators.
8. Workbank Planning/ Synergies (£25 million)
Workbank stability is about ensuring that works which have been planned go ahead, and that fewer unplanned jobs are added to the workbank. Giving supply chains a fixed and predictable workbank should lead to improved unit rates. It might avoid peaks and troughs in activity and optimise the utilisation of constrained resources, while reducing risk of rework and failures on delivery. Cost decreases are related to internal business actions surrounding the scheduling of works and the potential for a joined-up approach to project planning.
9. Supply Chain Organisation (SCO) initiatives (£19 million)
This initiative focuses onimproving the operational and logistical performance of Network Rail’s supply chain aiming to make the railway's supply chain more reliable, efficient and cost-effective. This is achieved by improving how Network Rail buys materials, strengthening supplier partnerships, cutting costs, and ensuring that materials required for rail maintenance and upgrades arrive on time. Efficiencies associated with SCO initiatives include national contracts which result in larger discounts through economies of scale.
10. Optimisation of access (use, agreement, planning) (£17 million)
This initiative is designed to improve how and when access to the railway network is planned and agreed. It aims to reduce disruption, increase efficiency, and deliver better value by coordinating access more effectively with industry partners, using smarter planning and streamlined agreements. Examples include use of blockades, using a shorter access window than would have previously been requested due to better use of time or preparations, or multiple renewals projects utilising the same access.
Headwinds, tailwinds, scope changes and input prices
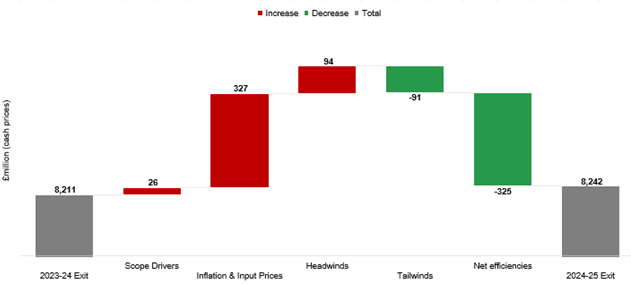
2.36 Network Rail analyses changes to its operations, support, maintenance and renewals costs over time through a ‘fishbone’ analysis which includes scope drivers (planned changes to levels of work undertaken), inflation and input prices (inflationary effects from increases or decreases in costs above general CPI inflation), headwinds (unplanned cost increases due to external factors such as changes to employers’ national insurance contributions), tailwinds (unplanned cost decreases due to external factors) and net efficiencies.
Figure 2.7: Network Rail GB’s cost drivers in April 2024 to March 2025
Source: ORR analysis of Network Rail’s data
2.37 Network Rail recorded £26 million in additional costs due to scope changes during the year. Increases in the scope of work (£194 million) and increased complexity (£24 million) were substantially offset by changes in the volumes of work (£67 million) and an overlay (£126 million), a buffer included in cost forecasts, used to help manage uncertainty and expected changes in costs.
2.38 Input prices totalled £327 million for the year, mainly driven by inflation (£218 million) and additional market-specific pricing pressures (£109 million).
2.39 Network Rail identified £94 million in headwinds in Year 1. The largest contributors were: pay and benefits (£22 million), primarily due to alignment with management pay award settlements; policy and legislation changes (£4 million); the impact of weather and environmental conditions (£4 million); and other costs (£60 million), which included incremental and prolonged project costs.
2.40 Network Rail benefited from £91 million in tailwinds during the year, mainly due to lower support costs as a result of reduced work supporting the development of HS2’s future connection to the national rail infrastructure.
Leading indicators of efficient delivery
2.41 This section provides an update on Network Rail’s preparations to deliver efficiently in April 2025 to March 2026 (Year 2 of CP7). Effective planning plays a key role in strengthening the resilience of the rail network and supporting a stable workload for Network Rail’s supply chain. It also enables the organisation to meet the growing efficiency challenge over the remainder of CP7.
2.42 Network Rail’s renewals planning for Year 2 is in a strong position. This will help to manage costs and maintain a stable workload for the supply chain. So far, 68% of renewal projects have been authorised, in line with Year 1 performance. Additionally, 87% of remits have been accepted and 85% of access secured—both improvements compared to the previous year. As shown in Table 2.3, Network Rail considers that over 80% of its regional 2025 to 2026 target efficiency will be achieved from projects that have already been delivered or have clear project plans (blue and green in Table 2.3 below). The remainder (less than 20%) have no clear project plans or have plans in place but low confidence in delivery.
Table 2.3: Network Rail’s assessment of the maturity of its April 2025 to March 2026 efficiency plans
Eastern | NW&C | Scotland | Southern | W&W | |
|---|---|---|---|---|---|
| Project delivered, waiting for benefits to be realised | 49% | 57% | 22% | 29% | 39% |
| Project in place with delivery plan and milestones | 39% | 28% | 53% | 57% | 59% |
| Strategic theme applied, commitment to deliver but no plan in place | 13% | 13% | 23% | 14% | 2% |
| Unknown | 0% | 2% | 2% | 0% | 0% |
100% | 100% | 100% | 100% | 100% |
Source: ORR analysis of Network Rail’s data
2.43 Chapter 5 provides a more detailed regional analysis of these leading indicators.
Income
2.44 For the year April 2024 to March 2025 Network Rail received £11.7 billion of income, a 7% year on year decrease (£12.7 billion previously). This excludes funding for enhancements which are funded separately by government on a project by project basis (Network Rail spent £2.1 billion on enhancements).
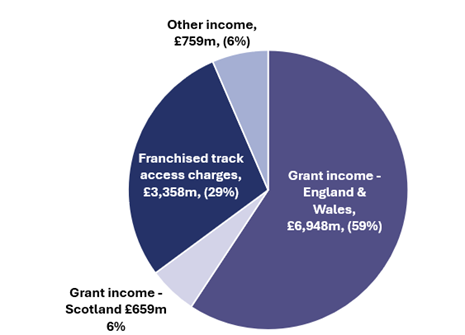
2.45 Figure 2.8 provides a breakdown of the main sources for this income. Overall income is lower than the previous year reflecting lower Network grants for the new control period and higher property disposals income in 2023-24, partly offset by higher traction electricity income this year.
Figure 2.8: Breakdown of Network Rail’s £11.7 billion of income (excl. enhancements) for April 2024 to March 2025
Source: ORR analysis of Network Rail’s data
Grant Income
2.46 Grant income refers to the funding received from the Government to support operations and projects across the rail network. Network Rail received £7,607 million of grant income (£6,948 million for England & Wales and £659 million for Scotland) in April 2024 to March 2025. This was £200 million less than set out in the delivery plan reflecting lower overall expenditure this year compared to the budget, particularly in renewals.
2.47 DfT funded £6,948 million for Network Rail’s England and Wales regions while Network Rail Scotland received £659 million for the Scotland region. This was split between £488 million in network grant funding by Transport Scotland and £171 million funded by DfT to pay for Network Rail Scotland’s share of financing costs, British Transport Police and corporation tax.
2.48 As grants are used to fund Network Rail’s operations, they reflect changes in expenditure rather than financial performance. Therefore, any differences between actual and budgeted grant income are considered neutral when assessing financial performance.
Franchised track access charges income
2.49 Franchised track access charges income comes from fees paid by train operating companies (excluding freight operators) to use its rail infrastructure. Franchised track access charge income was £3,358 million from April 2024 to March 2025, £36 million less than set out in the delivery plan, with £25 million underperformance recorded. This was mostly due to running fewer trains than anticipated and reduced traction electricity income, which was driven by lower unit costs, resulting in lower traction electricity, industry costs and rates expenses.
Other income
2.50 Other income includes revenue from freight operators including traction electricity, stations, property rentals and sales, and depot operations. Other income in year was £759 million broadly in line with the delivery plan, with £5 million of financial underperformance recognised.

