Financial performance
4.1 Over April 2024 and March 2025, Network Rail Scotland spent £1.4 billion on operating, maintaining, renewing, enhancing and financing the rail infrastructure. Due to financial pressures in the year, it reported a £26 million of financial underperformance against its CP7 delivery plan, as shown in Table 4.1. This means, net of income, Network Rail Scotland spent £26 million more than originally planned.
4.2 As explained in Chapter 1, the financial performance measure (FPM) for Network Rail compares its income and expenditure to the CP7 delivery plan (set in 2024). If a region has spent less or has received more income than the baseline for what it has delivered, it will report financial outperformance, and vice versa.
4.3 Table 4.1 shows that Network Rail Scotland’s underperformance in the year was largely driven by Renewals, Network Operations and Maintenance activities. Further details on expenditure and financial performance in each of the different categories in Table 4.1 are examined below.
Table 4.1: Network Rail Scotland’s financial performance April 2024 to March 2025
| £ million, cash prices | Actual | CP7 delivery plan | Variance | FPM out / (under) performance | % of FPM contribution |
|---|---|---|---|---|---|
| Grant income | 659 | 667 | (8) | 0 | 0% |
| Franchised track access charges | 516 | 517 | (1) | 2 | (8%) |
| Other income | 56 | 59 | (3) | (2) | 8% |
| Total income | 1,231 | 1,243 | (12) | 0 | 0% |
| Network operations | 85 | 77 | (8) | (8) | 31% |
| Support costs | 120 | 130 | 10 | 5 | (19%) |
| Traction electricity, industry costs and rates | 130 | 133 | 3 | (2) | 8% |
| Maintenance | 242 | 229 | (13) | (7) | 27% |
| Schedule 4 | 16 | 14 | (2) | 0 | 0% |
| Schedule 8 | (2) | 0 | 2 | 2 | (8%) |
| Total operating expenditure | 591 | 583 | (8) | (10) | 38% |
| Renewals | 422 | 460 | 38 | (16) | 62% |
| Enhancements | 154 | 160 | 6 | 0 | 0% |
| Total capital expenditure | 576 | 620 | 44 | (16) | 62% |
| Other costs | 0 | 31 | 31 | 0 | 0% |
| Financing costs | 253 | 273 | 20 | 0 | 0% |
| Total expenditure | 1,420 | 1,507 | 87 | (26) | 100% |
| Financial performance measure (FPM) | (26) | 100% |
Source: ORR analysis of Network Rail’s data. Numbers may not sum due to rounding. Note that total income does not equal total expenditure, this is because of the timing of recognition of income and expenditure (particularly in relation to financing costs) as explained in Network Rail’s regulatory financial statements.
Expenditure
Network operations costs
4.4 Network Rail Scotland spent £85 million on network operations activities (mostly signalling and stations management), representing 6% of the region’s total expenditure. It financially underperformed by £8 million due to increased signaller costs and additional expenditure on performance initiatives to improve passenger experience.
4.5 Other contributing factors included high costs from increased recruitment efforts to reduce reliance on overtime and address the challenges of an ageing skilled workforce. Additionally, pay awards for frontline staff were higher than expected, exceeding CPI.
Support costs
4.6 Support costs refer to auxiliary activities Network Rail needs to undertake to facilitate the core business such as human resources, finance and other corporate services.
4.7 Support costs in Scotland were £120 million in Year 1, representing 8% of total expenditure, with £5 million of financial outperformance recognised. Overall support costs were lower than the delivery plan forecast due to marginal savings across several areas, including one-off legal and restructuring costs.
Traction electricity, industry costs and rates
4.8 Network Rail Scotland spent £130 million in Year 1 on traction electricity, industry costs, rates, British Transport Police, ORR fees, the railway safety levy, RDG membership, and independent reporters’ fees. This represented 9% of total expenditure. This was in line with its plan and was largely offset by operator income for traction electricity. These costs are mostly outside Network Rail Scotland’s control and influenced by government policy and wider economic conditions and therefore are mostly not reflected in FPM.
Maintenance
4.9 Network Rail Scotland spent £242 million on maintenance in Year 1 of CP7, representing 17% of total expenditure and recorded £7 million underperformance.
4.10 The financial underperformance was driven by higher work volumes, greater-than-expected reactive maintenance needs, fewer than anticipated benefits of the maintenance modernisation programme, and above-inflation increases in material and contractor costs. Additionally, pay awards for front line staff were higher than CPI inflation.
Schedule 4 and Schedule 8
4.11 The Schedule 4 regime compensates train operators for planned reductions to network availability. It incentivises Network Rail to plan engineering work early and efficiently to reduce disruption. The Schedule 8 performance regime compensates train operators or Network Rail for the impact of unplanned service disruption.
4.12 Schedule 4 costs in Scotland were £16 million, £2 million higher than the delivery plan, mainly from delivering additional renewals works, requiring extra possessions. No financial outperformance or underperformance was recorded, indicating delivery was in line with planned financial expectations.
4.13 Network Rail Scotland received £2 million of Schedule 8 income from train operators, outperforming by £2 million. This was because although train performance was worse than delivery plan, a higher proportion of these delays were due to industrial action and fleet issues affecting train operators which resulted in compensation payments to Network Rail.
Renewals
4.14 In Year 1 of CP7, Network Rail Scotland spent £422 million on renewals, representing 30% of total expenditure.
4.15 There was a £38 million renewals underspend versus the delivery plan due to reprofiling of some activity to later years in the control period. The £16 million financial underperformance recorded was largely driven by track and signalling renewals, where actual costs exceeded delivery plan assumptions.
4.16 Track renewals were impacted by higher material costs and reduced productivity during possessions following safety concerns. Measures to protect track workers led to lower volumes without a corresponding reduction in costs. This resulted in increased unit rates. Additionally, worse-than-expected asset conditions required additional site preparation and surveys.
4.17 Signalling renewals also experienced cost pressures due to additional cabling needs arising from poor asset condition, higher-than-estimated material costs for the Blair Atholl to Dalwhinnie project, additional surveys for the Ayrshire signalling scheme, and increased costs associated with level crossing projects.
Enhancements
4.18 In Year 1 of CP7, Network Rail Scotland spent £154 million on enhancement projects funded by Transport Scotland, delivering new infrastructure capabilities. An additional £6 million was spent on schemes funded by third parties.
4.19 These costs accounted for 11% of total expenditure and were broadly in line with the delivery plan, with no financial outperformance or underperformance recorded, indicating delivery was in line with planned financial expectations.
4.20 Key enhancement projects undertaken in the year included East Kilbride and Barrhead Rail Enhancement scheme (£74 million), Feeder Stations programme (£44 million) and the Fife Decarbonisation programme (£15 million).
Risk Funding
4.21 Network Rail Scotland set aside £234 million of ring-fenced risk funding for unplanned costs in CP7. To date, 56% of this fund has been allocated across Network Rail Scotland’s plan for CP7 to manage financial pressures, mostly relating to increased National Insurance contributions (Years 2 to 5), Schedule 8 costs (years 1 and 2) and input prices expectations for the control period. This leaves Network Rail Scotland with £102 million (44%) of risk funding to manage additional financial risks over the remainder of CP7.
4.22 While the remaining level of risk funding is a concern, Network Rail’s Scotland’s stable delivery plan positions them well for continued delivery. This contrasts with England and Wales, where regions are reducing planned renewal volumes and face additional stretch to address a funding gap.
National functions & centrally managed expenditure
4.23 Costs incurred by Network Rail’s National Functions teams are re-charged to regions in proportion to their use of services provided by these functions and in accordance with the ORR’s CP7 regulatory accounting guidelines.
4.24 Around £370 million (10%) of national functions costs were recharged to Scotland in Year 1 of CP7, of which £253 million related to financing costs. Centrally managed costs allocated to Scotland were 11% lower than delivery plan. These reductions were related to savings across a number of central functions, with a share of these saving apportioned to Scotland.
Table 4.2: Allocation of centrally managed income and expenditure to Scotland
| £ million (cash prices) | Actual | Delivery plan | Variance Better/ (Worse) | Of which financial out / (under) performance |
|---|---|---|---|---|
| Network operations | 2 | 2 | 0 | 0 |
| Maintenance | 8 | 13 | 5 | 5 |
| Support costs | 71 | 82 | 11 | 6 |
| Traction electricity, industry costs and rates | 8 | 8 | 0 | 0 |
| Schedule 4 | 1 | 2 | 1 | 1 |
| Schedule 8 | 0 | 0 | 0 | 0 |
| Operating expenditure | 90 | 107 | 17 | 12 |
| Renewals | 27 | 37 | 10 | 7 |
| Enhancements | 0 | 0 | 0 | 0 |
| Capital expenditure | 27 | 37 | 10 | 7 |
| Financing costs | 253 | 273 | 20 | 0 |
| Taxation | 0 | 0 | 0 | 0 |
| Other | 253 | 273 | 20 | 0 |
| Total centrally managed expenditure | 370 | 417 | 47 | 19 |
Source: ORR analysis of Network Rail’s data. Numbers may not sum due to rounding.
Efficiencies
4.25 Network Rail Scotland reported £34 million of efficiency improvements, exceeding its 2024 delivery plan target of £26 million by 32%. As shown in Figure 4.1, the largest three initiatives within the year included:
1. Optimisation of access (use, agreement, planning) (£7 million)
Delivered through industry collaboration and data-driven strategies to improve efficiency while minimising disruption. Key actions included modernising access approaches and aligning with passenger demand.
2. Contracting strategies / packing / rates (£5 million)
Achieved through centralised sourcing, enhanced market engagement, and contract consolidation. This relied on close collaboration with routes and a strategic, performance-focused approach to tendering and contract management.
3. Workbank Planning / Synergies (£5 million)
Focused on optimising delivery through structured work packaging and maintaining a steady workbank to avoid peaks and troughs. Cross-organisational collaboration enabled effective resource planning, supported by early supply chain engagement
4.26 As explained in Chapter 2, at the start of the year we commissioned Nichols Group to undertake an independent assessment of Network Rail Scotland’s preparedness to deliver its efficiency plans in the first two years of CP7. Overall, Nichols found the plans to be reasonable. They recommended that Network Rail Scotland aim to overdeliver in the early years to help mitigate the risk associated with the more challenging efficiency targets set for Years 3 to 5.
Figure 4.1: Network Rail Scotland’s main efficiency initiatives in 2024-25 (£million)
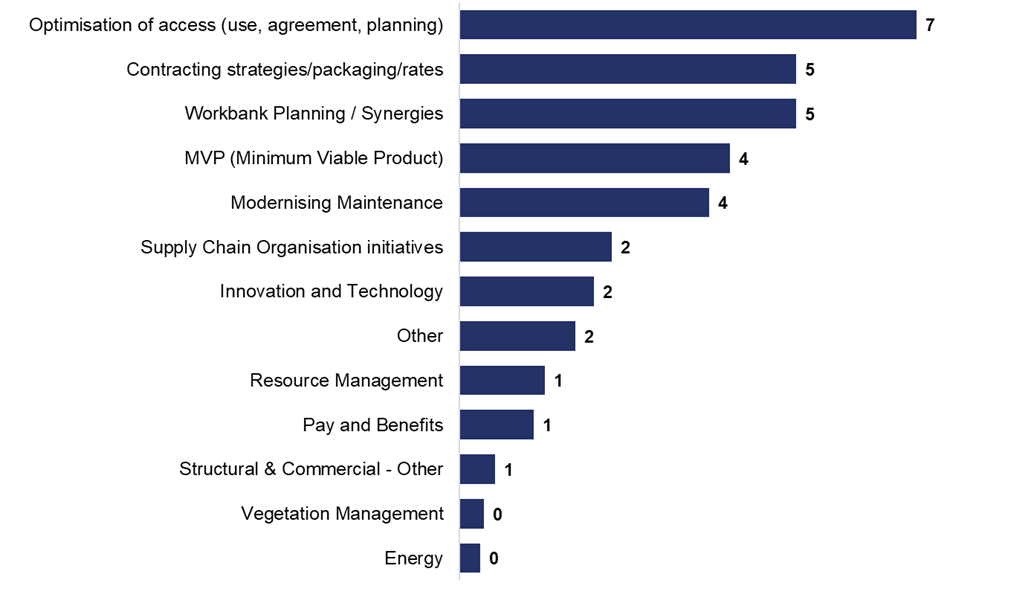
Source: ORR analysis of Network Rail’s data
4.27 Whilst Network Rail Scotland has generally made good progress at improving its efficiency in CP7, as shown earlier in the chapter it has underperformed on FPM. This is largely due to the structural differences between the two measures, as explained in Annex B.
Efficiencies, headwinds, tailwinds, scope changes and input prices
4.28 Figure 4.2 demonstrates all the drivers impacting Network Rail Scotland’s costs in the last year.
Figure 4.2: Network Rail Scotland’s cost drivers April 2024 to March 20
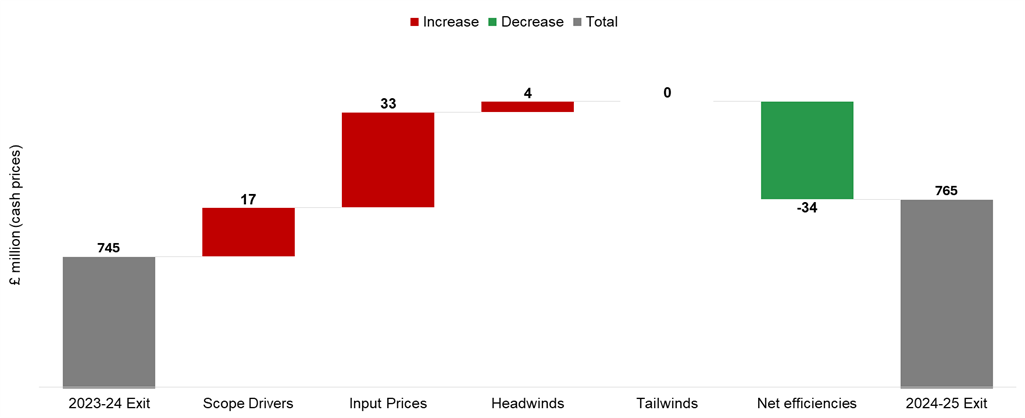
Source: ORR analysis of Network Rail’s data
4.29 Efficiencies are only one type of cost driver:
- Scope drivers refer to one-off events or changes to standards, legislation and scope since the CP6 Year 5 (2023-24) exit. Key scope changes in Year 1 were in structures and earthworks, the asset improvement programme and additional examinations of civil infrastructure arising from the Civil Examination Framework Agreement (CEFA).
- Inflation and Input prices refer to impacts of general price inflation and specific pricing pressures on costs beyond general price inflation.
- Headwinds encompass other cost drivers which increase the cost of delivery, which are beyond Network Rail’s immediate control. Headwinds in Year 1 included capital delivery underutilisation due to a downturn in enhancements, management pay awards and a sinkhole at Caldercruix.
- Tailwinds refer to cost drivers which decrease the cost of delivery, which are beyond Network Rail’s immediate control. As shown in the chart above, no tailwinds were recorded for the last year.
Leading indicators of efficient delivery
4.30 At the beginning of the control period, Network Rail as a whole, targeted £3.9 billion (cash prices) of efficiencies for CP7, £389 million (cash prices) of which was to be achieved by Network Rail Scotland.
4.31 This section provides an update on Network Rail Scotland’s preparations to deliver efficiently in April 2025 to March 2026 (Year 2 of CP7).
4.32 Network Rail Scotland is forecasting £62 million in efficiencies for the period April 2025 to March 2026. Of this, 75% is expected to come from projects that were either already underway or had well-defined plans by the end of the first year of the control period. The remaining 25% relates to initiatives that either lacked clear project plans or had plans in place but with low confidence in delivery. These confidence ratings were slightly lower than those observed in other regions.
4.33 At the end of Year 1, Network Rail Scotland scored well on our wider suite of leading indicators of possessions and renewals planning: 88% of disruptive access to undertake planned engineering work in Year 2 had been booked (ahead of the national average of 85%), 89% of its renewals remits for Year 2 had been issued and accepted by its supply chain (in line with other regions) and 67% of Year 2 renewals projects had been internally authorised (close to the national average of 68%)
Income
4.34 Network Rail Scotland received £1.2 billion of income in April 2024 to March 2025 (excluding enhancement grants and increases in financing costs related to indexed linked debt).
Grant funding
4.35 Network Rail Scotland received £488 million in network grant funding in Year 1, consistent with its CP7 delivery plan. Network grant income is higher than the previous year, reflecting funding and outputs required for CP7.
4.36 There are separate grant income arrangements with DfT to pay for Network Rail Scotland’s share of financing costs, British Transport Police and corporation tax. Network Rail Scotland received £171 million for these, £8 million less than set out in the delivery plan for the year, reflecting lower financing costs, and so less grant was required to meet these expenses.
4.37 Network Rail Scotland also receives enhancement grant funding (although this is not included under ‘income’ in Table 4.1). The Scottish Government funded £154 million of enhancements to Network Rail’s infrastructure in Scotland, with an additional £6 million of funding for enhancements form other third parties.
4.38 Oversight of the flexibility of grant payments within Scotland continues to fall within the remit of Transport Scotland and the Scottish Government’s budgetary process for CP7. Transport Scotland confirmed that the budgetary flexibilities available in CP6 will broadly continue for CP7.
4.39 Grants are classified outside of Network Rail control and are therefore treated as neutral when assessing financial performance.
Franchised track access charges
4.40 Franchised track access charges income comes from fees paid by train operating companies (excluding open access and freight operators) to use Network Rail Scotland’s rail infrastructure.
4.4 Track access charges income was £516 million, broadly in line with budget, with £2 million outperformance. Franchised track access charges are lower than the previous year mainly due to reduced Infrastructure cost charges as a higher proportion of the funding to run the network came via Network grants from Transport Scotland instead. This is consistent with our PR23 determination.
Other income
4.42 Other income includes freight and stations income, property rental and sales income, depots income and freight traction electricity income.
4.43 Network Rail Scotland received £56 million of other income, with £2 million of financial underperformance due to lower than expected franchised stations lease income.