5.1 This chapter provides an analysis of the efficiencies and wider financial performance of each of Network Rail’s five regions: Eastern, North West and Central (NW&C), Scotland, Southern, and Wales and Western (W&W). The financial information reported for each region includes its allocation of the national functions’ income and costs. Caution is needed when comparing the relative performance of regions due to the differences in their geographical and operational characteristics.
Financial performance
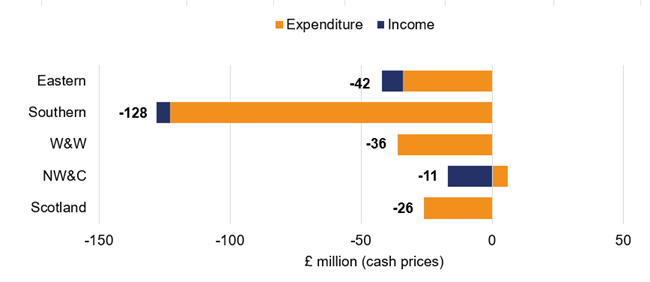
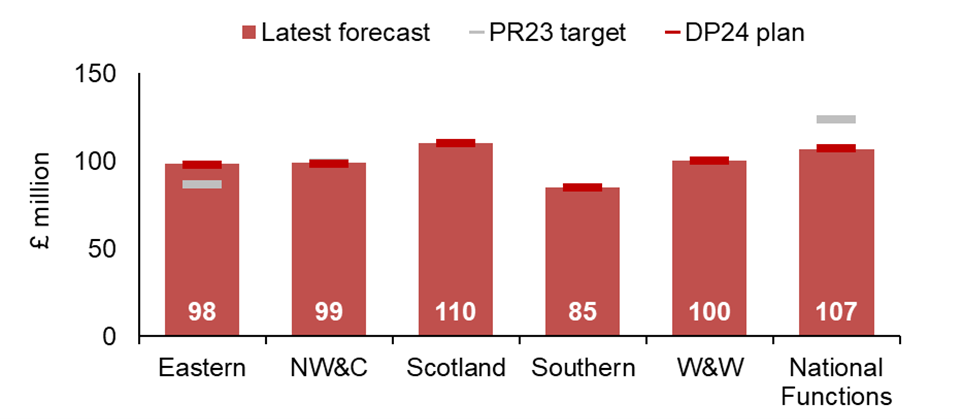
5.2 As shown in Figure 5.1, all regions financially underperformed compared to their delivery plan for the year. Annex A provides detailed financial tables for each region.
Figure 5.1: Regional contributions to Network Rail’s financial underperformance, April 2024 to March 2025
Source: ORR analysis of Network Rail’s data
5.3 The key categories of out- and under-performance across each of the regions are examined in further detail below. Differences from the net FPM for each region is due to focussing on the main drivers of financial out- under-performance.
Eastern
5.4 Eastern underperformed by £42 million compared to its delivery plan. The region attributes this underperformance largely to:
- Renewals (£59 million underperformance). This was due to prolongation costs associated with signalling projects arising from delays and concerns over safety and reliability issues.
- Schedule 8 (£30 million underperformance). This was due to poor train performance and higher than planned number of service cancellations resulting in additional compensation payments to train operators.
- Maintenance Costs (£13 million underperformance). This was due to reactive maintenance requirements for civils and buildings and above CPI pay awards for non-management staff.
5.5 Eastern’s underperformance was partially offset, by outperformance largely relating to:
- Schedule 4 (£48 million outperformance). This was due to fewer impactful weather events, productive engineering possessions, better workbank planning and strong project volume delivery.
- Enhancements (£20 million outperformance). This was largely due to strong delivery on the TransPennine Route Upgrade program.
North West and Central
5.6 North West and Central underperformed by £11 million. The region attributes this underperformance largely to:
- Maintenance costs (£42 million underperformance). This was due to additional use of agency staff to support delivery while recruitment and training was taking place, above CPI pay rises for non-management staff, higher reactive maintenance activity and increased structures inspection costs.
- Renewals (£25 million underperformance). This was due to issues in track delivery as a result of lower utilisation of work delivery teams increasing costs, access constraints and sunk costs from cancelled projects.
- Schedule 8 (£25 million underperformance). This was due to poor train performance resulting in additional compensation payments to train operators.
5.7 North West and Central’s underperformance was offset by outperformance largely relating to:
- Support Costs (£41 million outperformance). This was due to savings being made in the following areas such as, Route Services - Digital Data & Technology, Insurance, system operator and regionally managed activity.
- Enhancements (£43 million outperformance). This was due to improvements in planning and delivery of the East West Rail project.
Southern
5.8 Southern underperformed by £128 million. This was the largest underperformance amongst all regions. The region attributes this underperformance largely to:
- Renewals (£131 million underperformance). This underperformance was largely due to delays in major signalling projects leading to project prolongation costs. There was also underperformance from higher material and sunk costs from workbank reprioritisation.
- Maintenance (£25 million underperformance). This was due to additional use of agency staff to support delivery while recruitment and training was taking place along with above CPI pay rises for non-management staff.
- Schedule 8 (£24 million underperformance). This was due to poor train performance and higher than planned number of service cancellations resulting in additional compensation payments to train operators.
5.9 Southern’s underperformance was partially offset by outperformance relating largely to:
- Schedule 4 (£32 million outperformance). This outperformance was due to fewer impactful weather events and productive engineering possessions.
- Support Costs (£27 million outperformance). This has been driven by a higher proportion of project expenditure being treated as capital investment, savings in insurance and utility costs, along with a favourable settlement of a commercial claim.
Wales and Western
5.10 Wales and Western underperformed by £36 million. The region attributes this underperformance largely to:
- Renewals (£28 million underperformance). This was due to signalling issues relating to Port Talbot access and further access constraints across the region.
- Maintenance costs (£19 million underperformance). This was due to additional use of agency staff to support delivery while recruitment and training was taking place, above CPI pay rises for non-management staff and performance improvements schemes.
- Enhancements (£10 million underperformance). This was largely due to project prolongation costs on the Oxford corridor capacity works.
5.11 Wales and Western’s underperformance was partially offset by outperformance largely relating to:
- Schedule 4 (£22 million outperformance). This was due to fewer impactful weather events on the network, better workbank planning and stronger project volume delivery.
Scotland
5.12 Detailed information on Network Rail Scotland’s financial performance can be found in Chapter 4.
Efficiencies
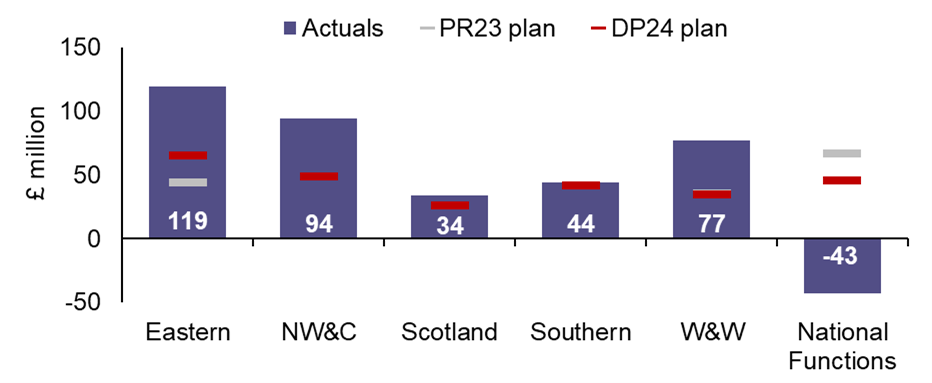
5.13 As shown in Figure 5.2, all regions exceeded their delivery plan (DP24) efficiency targets in April 2024 to March 2025. Reporting of efficiency improvements is not a precise discipline, and judgement is required in assessing whether all costs and benefits have been captured. Network Rail’s Group Finance has applied an overlay/reduction to Network Rail’s total reported efficiency. This adjustment is recorded under ‘National Functions and Overlay’ and it reflects initiatives where internally reported figures could not be fully validated or where assurance processes are still ongoing.
Figure 5.2: Regional contributions in efficiency April 2024 to March 2025 and CP7 efficiency forecast
Source: ORR analysis of Network Rail’s data
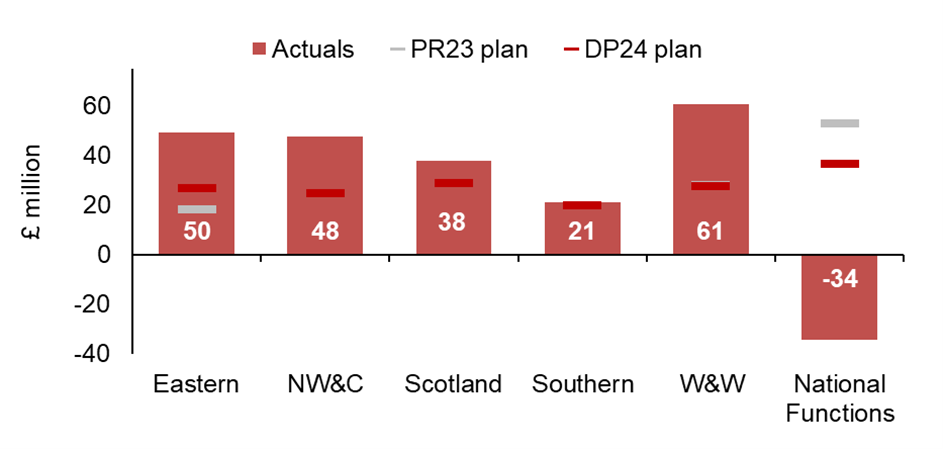
5.14 Figure 5.3 normalises the information in Figure 5.2 by adjusting each region’s efficiency contribution relative to its total OSMR (Operations, Support, Maintenance and Renewals) expenditure. This normalisation reflects the different sizes and operational characteristics of each region.
Figure 5.3: Regional efficiencies in April 2024 to March 2025 and CP7, normalised by OSMR expenditure (£ million per £ billion OSMR)
Source: ORR analysis of Network Rail’s data
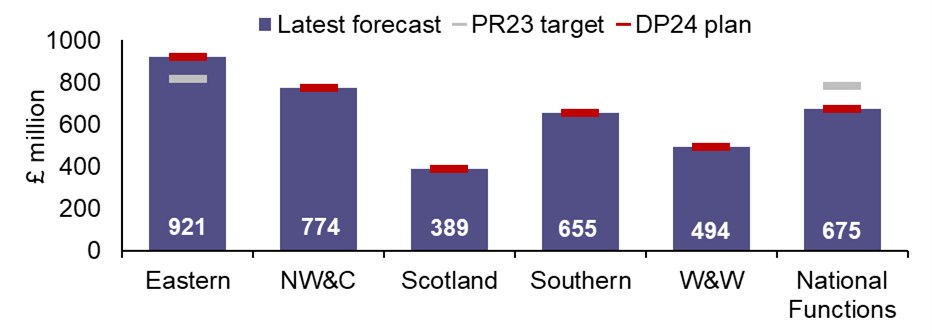
5.15 Regional contributions to Network Rail’s CP7 efficiency trajectory are shown in Figure 5.4.
Figure 5.4: Regional contributions to actual and forecast efficiency in each year of CP7
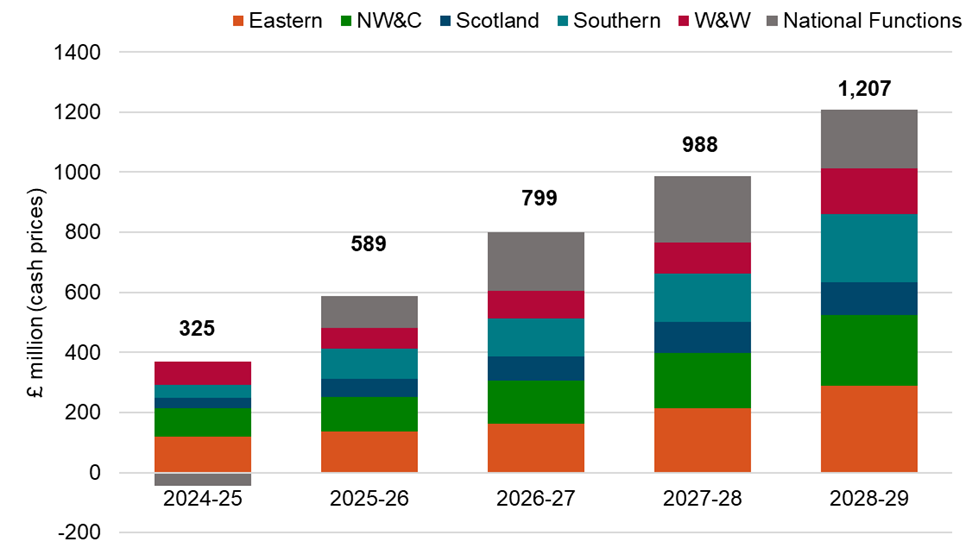
Source: ORR analysis of Network Rail’s data
Eastern
5.16 Eastern reported £119 million of efficiency improvements in April 2024 to March 2025, exceeding its delivery plan of £65 million by 83%. It is aiming to deliver £921 million of efficiency improvements in CP7.
5.17 The largest efficiency initiative for the region in the year was Workbank Planning and Synergies (£26 million). Key drivers of this efficiency were improved recruitment controls, continued workforce attrition and voluntary severance schemes. Other top performing initiatives included Contracting Strategies, Packaging and Rates (£16 million) and Modernising Maintenance (£15 million).
North West and Central
5.18 North West and Central reported £94 million of efficiency improvements in April 2024 to March 2025, exceeding its delivery plan of £49 million for the year by 92%. It is aiming to deliver £774 million of efficiency improvements in CP7.
5.19 The largest efficiency initiative for the region in the year was Contracting Strategies, Packaging and Rates (£34 million). Benefits from this initiative arose from enhanced collaboration between routes leading to stronger supply chain relations and sharing of expert knowledge. Other top performing initiatives included Modernising Maintenance (£14 million) and Minimum Viable Product (£12 million).
Scotland
5.20 Detailed information on Network Rail Scotland’s efficiency delivery can be found in Chapter 4.
Southern
5.21 Southern reported £44 million of efficiency improvements in April 2024 to March 2025, exceeding its delivery plan of £42 million by 5%. While this represents an outperformance, it lags behind the levels of outperformance achieved by other regions. Southern is aiming to deliver £655 million of efficiency improvements in CP7.
5.22 The largest three efficiency initiatives for the region in the year were Modernising Maintenance (£9 million), Contracting Strategies, Packing and Rates (£6 million) and Delivering Output for a Lower Activity and Volume (£6 million).
Wales and Western
5.23 Wales and Western reported £77 million of efficiency improvements in April 2024 to March 2025, exceeding its plan of £35 million for the year by 120%. It is aiming to deliver £494 million of efficiency improvements in CP7.
5.24 The largest three efficiency initiatives for the region in the year were Structural & Commercial – Improved Access (£22 million), Delivering the Same Output for Lower Activity and Volume (£13 million) and
Contracting Strategies, Packing and Rates (£12 million).
5.25 Detailed information on Network Rail’s five largest efficiency initiatives across regions in Year 1 can be found in Annex C.
Leading indicators of efficient delivery
5.26 This section examines regions preparedness for efficient delivery of Year 2 of CP7. Effective planning is important because it improves the robustness of the rail network and helps to provide a stable profile of work for Network Rail’s supply chain. Better planning will also help Network Rail to deliver the increasing efficiency challenge over the remainder of CP7. Better documentation is also important to evidence that efficiencies have been delivered and are likely to be delivered in future.
5.27 Overall, Network Rail either exceeded or was close to delivering its leading indicator targets for April 2025 to March 2026 (Year 2). While there are still some improvements which could be made, based on the evidence that we have reviewed, we consider that Network Rail seems to be reasonably well prepared to deliver the remainder of its CP7 target efficiencies. However, the company will need to carefully manage the risks associated with delivery, particularly given the increase in efficiency targets over the remainder of the control period.
5.28 In the below charts (Figures 5.5 to 5.9) the national columns relate to the national average and not the National Functions business unit.
Disruptive access for April 2025 to March 2026
Figure 5.5: Disruptive access
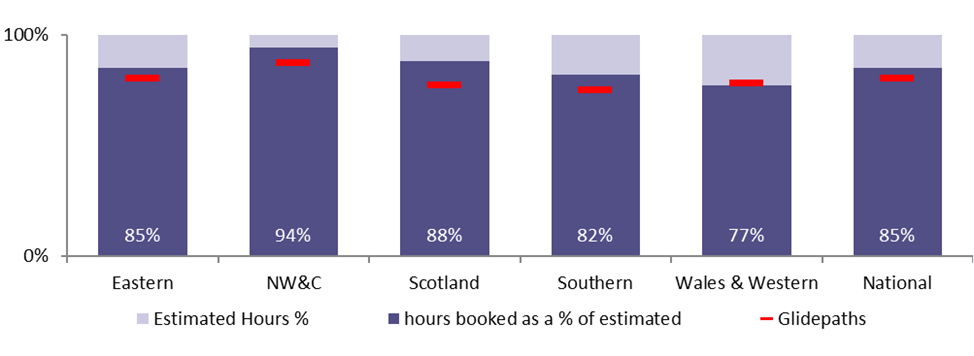
Source: ORR analysis of Network Rail’s data
5.29 As shown in Figure 5.5, 85% of the disruptive access for engineering works have been secured for Year 2 of CP7. This is above its glidepath of 80%. On this basis, all regions would exceed their glidepath targets during the year, except for Wales & Western. Both Wales and Western and Scotland have collaborated with suppliers to reduce the risk of disruptive access and ensure more efficient works.
Financial authorisations for April 2025 to March 2026
Figure 5.6: Financial authorisations
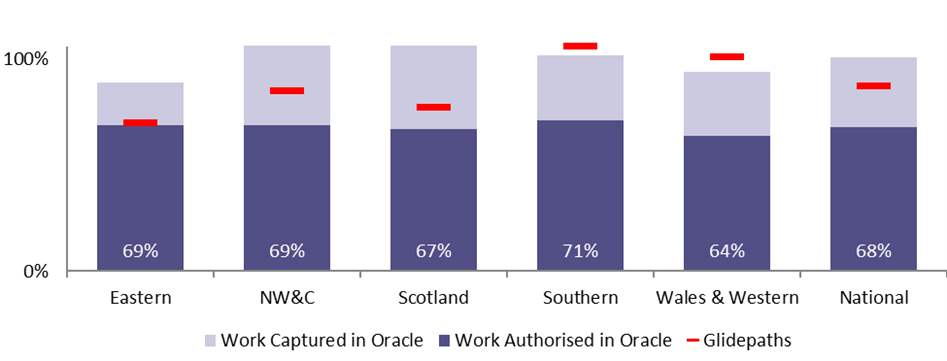
Source: ORR analysis of Network Rail’s data
5.30 shown in Figure 5.6, Network Rail’s authorised spend on renewals projects as a percentage of planned spend is 68%. This is below the national glidepath target of 87%. All regions do not appear to have authorised enough work during the year to achieve their glidepath.
Renewal remits for April 2025 to March 2026
Figure 5.7: Renewals remits issued and accepted
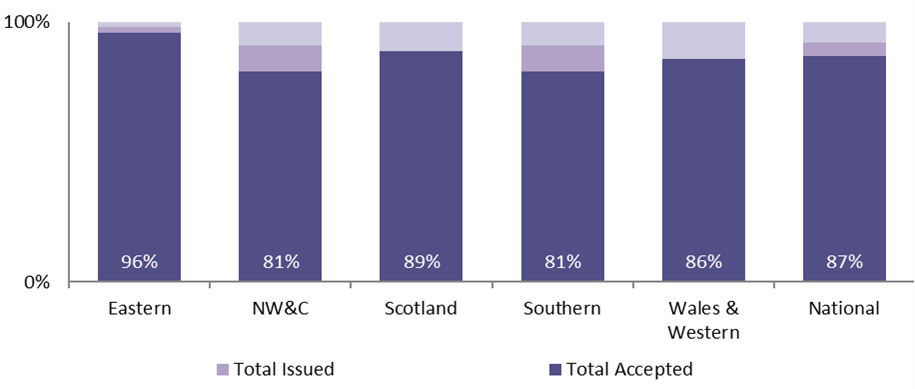
Source: ORR analysis of Network Rail’s data
5.31 Financial authorisations only provide a partial picture of renewals workbank planning, while remits issued and accepted by the supply chain show progress made at an earlier stage of the planning lifecycle. This indicator shows the value of renewals remits accepted and issued to deliverers as a percentage of the value of remits required. Nationally, 92% of workbank remits have been issued while 87% have been accepted. This level of alignment represents a positive position and indicates good engagement with the supply chain.
Maintenance headcount for April 2025 to March 2026
Figure 5.8: Maintenance headcount
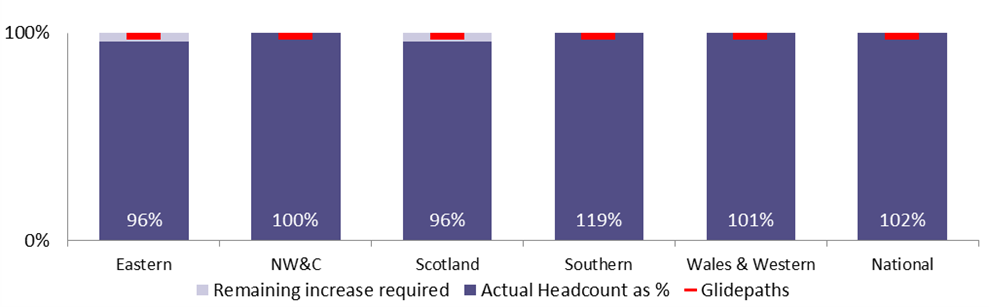
Source: ORR analysis of Network Rail’s data
5.32 Direct maintenance headcount has increased during the year across the majority of regions. Nationally, maintenance headcount is at 102%, above the projected glidepath of 98%. This indicates a good level of readiness to deliver maintenance work effectively in Year 2. North West and Central, Southern and Wales and Western are all above the glidepath due to maintenance recruitment occurring earlier than anticipated. Eastern and Scotland both finished below the glidepath achieving 96% due to complications with modernising maintenance and slower recruitment.
Efficiency plans Blue Red Amber Green (BRAG) Ratings for April 2025 to March 2026
Figure 5.9: Maturity of Network Rail’s Year 2 efficiency plans Source: ORR analysis of Network Rail’s data
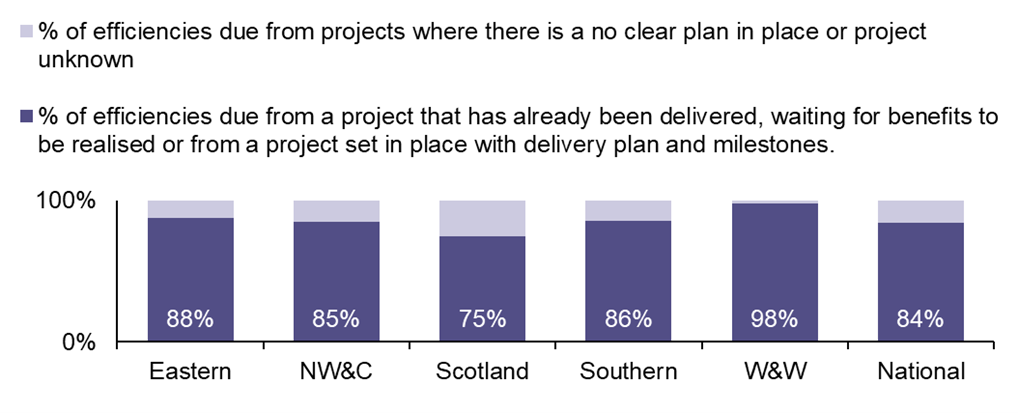
Source: ORR analysis of Network Rail’s data
5.33 As shown in Figure 5.9, Network Rail considers that 84% of its regional Year 2 target efficiency will be achieved from projects that have already been delivered or have clear project plans. The remaining 16% have no clear project plans or have plans in place but low confidence in delivery. These confidence ratings vary across regions. We consider that Network Rail seems reasonably well prepared to deliver its Year 2 target efficiencies.