A.1 This annex discusses:
- changes to National Highways’ funding for the second road period (RP2);
- how the company spent its funding between April 2022 and March 2023 (the reporting year);
- its forecast capital expenditure and use of risk funding for RP2;
- its forecast total outturn expenditure for its enhancements portfolio (for RP2 and future road periods); and
- detailed efficiency evidence assessment.
Overview of funding changes for the second road investment strategy (RIS2)
A.2 In the reporting year, the Department for Transport (DfT) increased National Highways’ total RIS2 resource funding by £100 million to £6,109 million. This was due to a transfer of £100 million from capital funding in the next reporting year to meet inflationary pressures.
A.3 National Highways’ RIS2 capital funding was reduced by £100 million to £17,901 million due to the transfer to resource funding. In addition, National Highways moved £357 million capital funding from year three (the reporting year) to a later year using the company’s ‘capital flex’ facility to move up to 10% of funding between years.
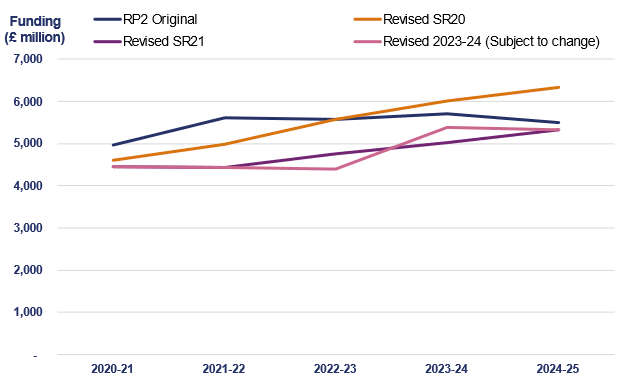
A.4 The National Highways’ 2023 delivery plan notes that the above is subject to change within the total RIS2 funding remaining at £24,009 million. Figure A1 shows how the funding profile has changed since the start of the road period.
Figure A.1: Annual funding profile at the start of RP2 and as revised through Spending Review 2020(SR20), Spending Review 2021(SR21) and Revised 2023-2024 (£ million)
April 2022 to March 2023 funding
A.5 In the reporting year, National Highways’ original budget was £4,774 million. This was split between £3,571 million for capital expenditure and £1,203 million for resource expenditure.
April 2022 to March 2023 capital expenditure
A.6 National Highways identified early in the reporting year that it would not require all the capital funding budgeted for the year. This was principally due to changes made to the enhancements portfolio in the final months of the previous reporting year, after the current year’s budget had already been agreed.
A.7 National Highways indicated to DfT that it wished to use its capital flex facility to move £357 million of its capital funding to a later year. This was the maximum that the company was able to move without government approval.
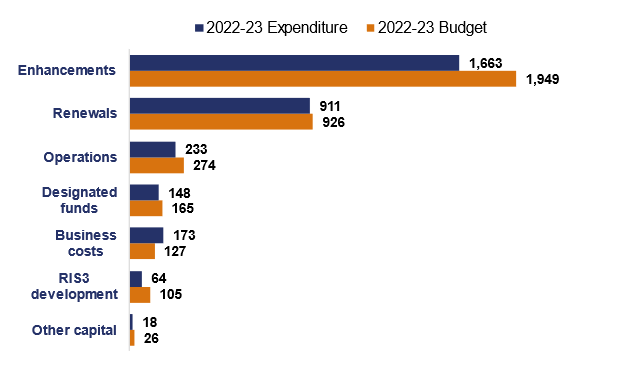
A.8 During the reporting year, slippage on some large enhancement schemes continued, for example A428 Black Cat to Caxton Gibbet which further reduced expenditure. However, inflation was higher than anticipated creating an unexpected partially offsetting cost pressure. National Highways spent £3,211 million within the year which was an underspend of £360 million. Therefore after taking account of the £357 million movement to a later year, the company underspent by £3 million.
Figure A.2: Capital expenditure against budget April 2022 to March 2023 (£ million, rounded)
Enhancements
A.9 In the reporting year, National Highways spent £1,663 million on enhancements. This was £286 million (14.7%) less than planned. The majority of this underspend relates to the funding identified by the company that was not required in this reporting year, see paragraph A7. This included £240 million arising from delays to schemes in achieving their Development Consent Orders (DCOs), £85 million due to the funding mismatch of the Transport Select Committee (TSC) smart motorway report outcome, where budgets were set for the reporting year prior to the TSC recommendations being announced, and £59 million of other, non-DCO-related, scheme slippage.
A.10 These underspends were offset by some overspends against specific schemes, for example the A1 Birtley to Coal House overspent by £49 million due to costs on the Allerdene Bridge and increases in the cost of steel. The A30 Chiverton to Carland Cross overspent by £47 million due to increases in construction costs and work on drainage, earthworks and pavement being brought forward into the reporting year.
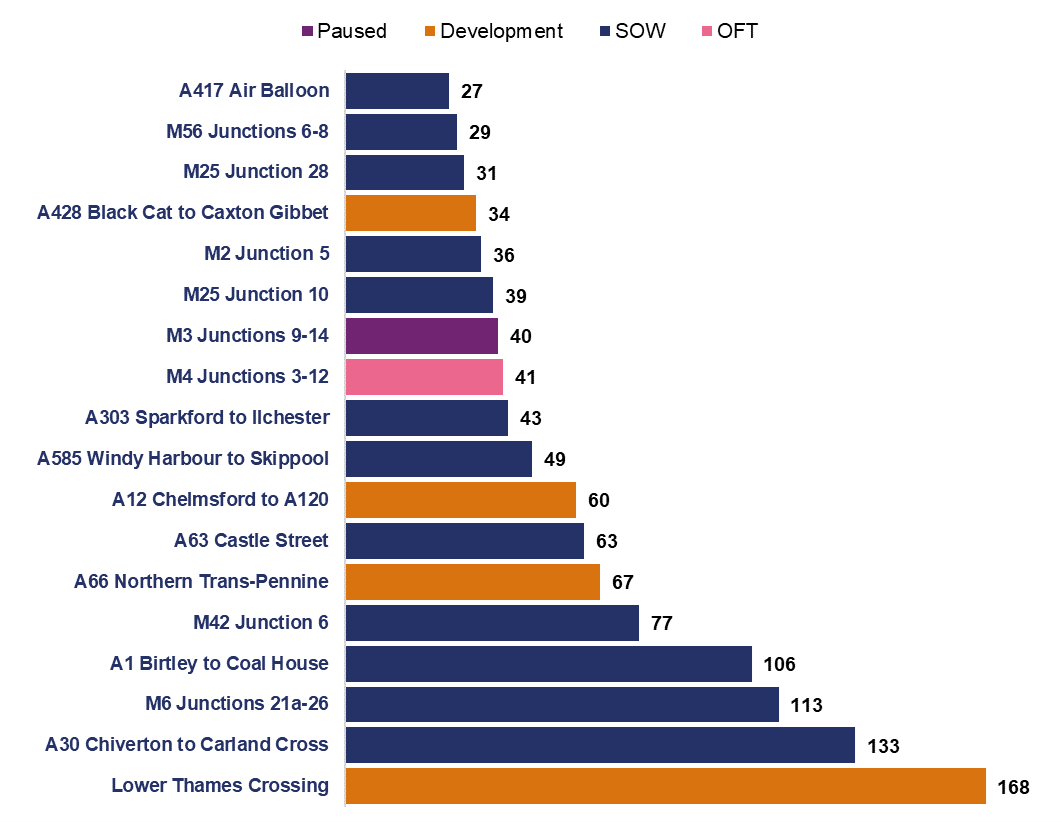
A.11 The enhancements category includes, but is not limited to, expenditure on delivering enhancement schemes. There were 18 enhancement schemes where National Highways spent more than £25 million. Figure A3 shows the expenditure incurred and the phase of the schemes at the end of the reporting year. As expected, many of these schemes are currently in construction as this is where most expenditure is incurred.
A.12 However, Lower Thames Crossing is the scheme with the largest spend in the reporting year (£168 million) and is in the development phase. This was an overspend of £38 million and relates to multi-year leases for land required for the scheme.
Figure A.3: Enhancement schemes with in-year spend greater than £25m by scheme phase (£ million)
Third road investment strategy (RIS3) development
A.13 National Highways spent £64 million on RIS3 enhancements development in the reporting year, £41 million (39%) less than it planned. This is due to several projects in the pipeline being deferred by the DfT in March 2023 for consideration for inclusion in RIS4.
Renewals
A.14 National Highways spent £911 million on renewals in the reporting year, £14 million (1.5%) less than planned. The budget included £36 million of renewals risk reserve; only £22 million was drawn down in year, resulting in the £14 million underspend. This funding will be rolled forward to be utilised when required over the remaining two years of the road period. More detail on renewals performance and delivery can be seen in paragraphs 3.42 to 3.44.
Designated funds
A.15 National Highways spent £148 million on designated funds in the reporting year. This was £17 million (10.3%) less than planned. This is due to the company underspending by £30 million against the Innovation and Modernisation fund as a result of difficulty in identifying appropriate projects for approval and progression. This underspend was slightly offset by overspends against the three other funds. See paragraphs 5.56 to 5.63 for further details on designated funds.
Business costs
A.16 National Highways spent £173 million on business costs in the reporting year, £46 million (36.2%) more than planned. This is due to a combination of increased digital services spend and less income than expected from disposals.
Operations
A.17 National Highways spent £233 million on operations in the reporting year. This was £41 million (15%) less than planned. This was caused by managed slippage into the next reporting year across a number of projects and schemes.
Other capital expenditure
A.18 National Highways spent £18 million on capital works associated with Operation Brock in the reporting year. This was £8 million (30.8%) less than planned. This is because when Operation Brock is in operation capital works are suspended. The capital works unable to take place in this reporting year will now take place in the next reporting year.
Resource expenditure in the reporting year
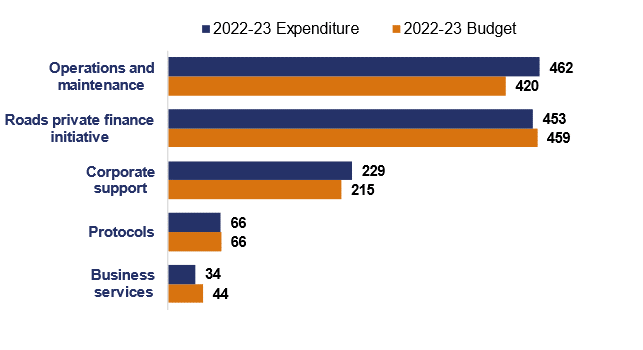
A.19 In the reporting year, National Highways spent £1,244 million of resource funding. This was an overspend of £41 million compared to the original budget of £1,203 million, but an overspend of £9 million against the revised funding position of £1,235 million. The budget was increased by £32 million, following DfT agreement to £32 million additional funding outside of the RIS.
Figure A.4: Resource expenditure against budget April 2022 to March 2023 (£ million, rounded)
Operations and maintenance
A.20 National Highways spent £462 million on operations and maintenance in the reporting year. This was £42 million (10%) more than planned. This was a net position of a number of under and overspends in different areas. See paragraphs 3.53 to 3.55 for further details on operations and maintenance spend.
Private Finance Initiative (PFI) contracts
A.21 National Highways spent £453 million on PFI contracts (public sector projects financed through the private sector) in the reporting year, £6 million (1.3%) less than planned. Inflation impacted spend on committed costs in this area. However, the company was able to offset the impact of this by identifying savings through review of contractual commitments.
Corporate support
A.22 National Highways spent £229 million on corporate support in the reporting year, £14 million (6.5%) more than planned. It was largely because this category holds £19 million of general corporate support cost pressure anticipated when the business plan for the reporting year was agreed. This is also where the company recorded its £6 million unfunded spend on Operation Brock. These overspends were slightly offset by savings in Digital Services.
Business services
A.23 National Highways spent £34 million on business services in the reporting year. This was £10 million (22.7%) less than planned. This is mostly due to slower than expected recruitment.
Protocols
A.24 The Secretary of State for Transport requires National Highways to perform protocols services on their behalf. These cover functions or activities that are not core to its role as a strategic highways company. The company spent £66 million on protocols in the reporting year which was in-line with the budget.
RP2 capital expenditure forecast
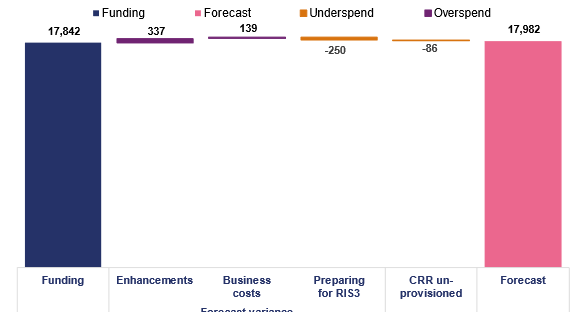
A.25 National Highways is forecasting to spend £17,982 million across RP2 against its capital funding allocation of £17,842 million. This is an overspend of £140 million (0.8%) and includes variances of:
- £337 million (3.3%) overspend on enhancements (see paragraphs A28 to A32);
- £139 million (8.2%) overspend on business costs relating to National Highways’ Digital Data and Technology Strategy; and
- £250 million underspend (49%) on preparing for RIS3 reflecting reduced scope of work following the Secretary of State’s Written Ministerial Statement on 9 March 2023.
- £86 million underspend on ‘unprovisioned’ Central Risk Reserve (CRR), for which the company has not identified a spending need. Provisioned CRR of £1,271 million is already reflected in other expenditure category budgets.
Figure A.5: RIS2 capital funding and forecast variance at April 2023 (£ million)
A.26 Table A1 shows how the overspend on enhancements is broken down between enhancement schemes (with RP2 delivery milestones) in the delivery plan and other enhancements.
Table A.1: Enhancements RP2 forecast cost analysis
| Baseline (£ million) | Forecast (£ million) | Variance (£ million) | Percentage variance | |
|---|---|---|---|---|
| Enhancement schemes | 9,298 | 8,806 | 492 | 5% |
| Other enhancements | 925 | 1,754 | -829 | -90% |
| Total enhancements | 10,223 | 10,560 | -337 | 3% |
A.27 The ‘other enhancements’ budget covers the cost of smart motorway action plan deliverables, legacy costs of previously completed projects, contributions to schemes delivered by third parties and safety congestion works deferred from the first road period. However, in the last quarter of the reporting year, National Highways also included within other enhancements its £500 million assessment of the cost impact on the enhancement portfolio of higher inflation that is not yet included in scheme cost forecasts. It also reduced the enhancements baseline by £200 million for a £100 million funding transfer to resource expenditure in 2023-24 and further £100 million expected in 2024-25.
A.28 The company intends to reflect these changes in enhancement scheme baseline and forecast changes in its baseline update in the next reporting year. This will give a clearer view of the impact of inflation at scheme level.
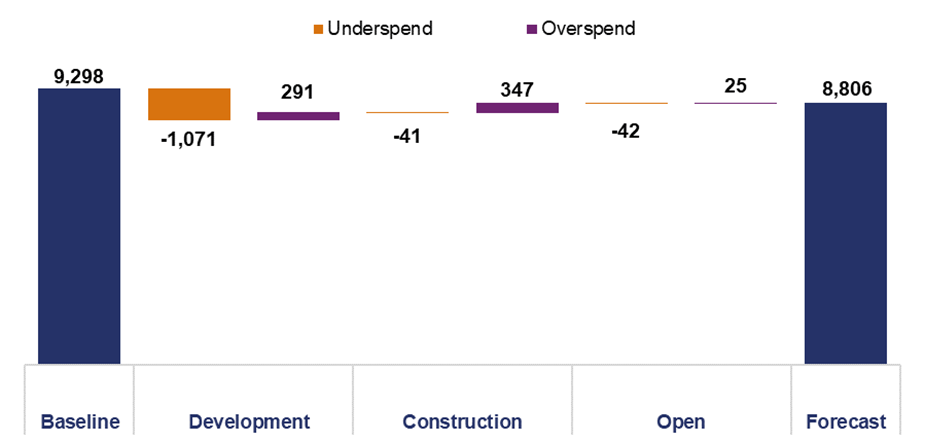
A.29 However, analysis of forecast scheme variances by phase shows the impact on the financial position of further scheme delays despite re-baselining after the funding reduction in Spending Review 2021. Eleven schemes in the development phase have underspends totalling £1,071 million predominantly due to ongoing challenges in achieving planning consent.
Figure A.6: RP2 enhancement scheme variance between baseline and forecast by current scheme phase as at 31 March 2023 (£ million)
A.30 As discussed in paragraphs 2.63 to 2.66, the delays in achieving planning consent for several schemes is reducing forecast cost pressure in RP2 but is driving up forecast costs in later road periods.
Figure A.7: RIS2 schemes total forecast cost reducing in RP2 and increasing in RP3 and beyond (£ million)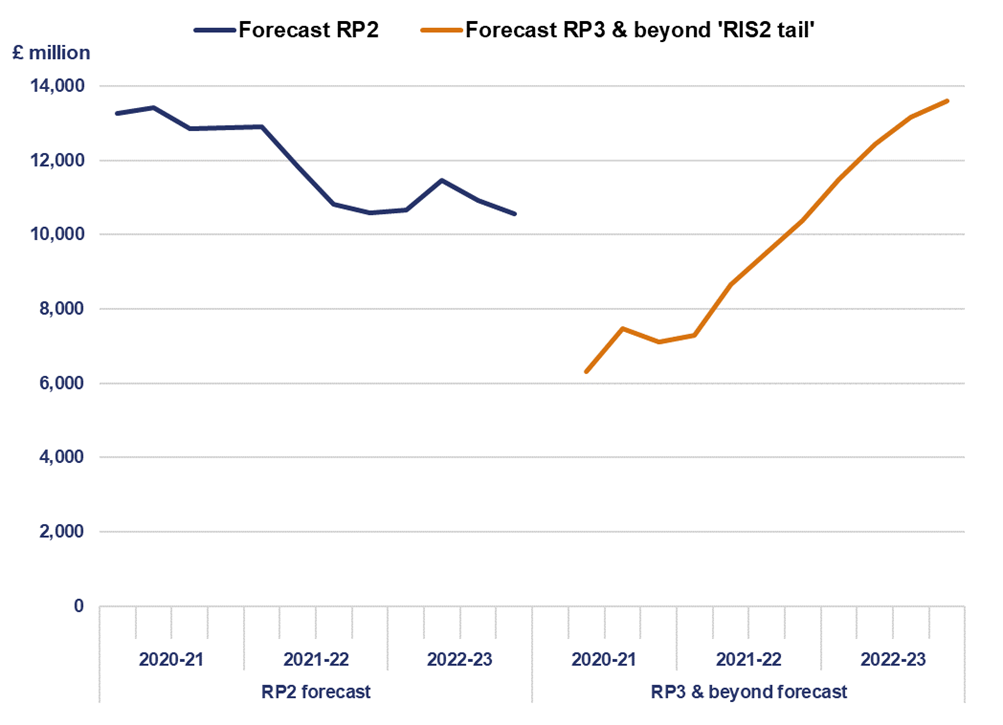
Central risk reserve
A.31 National Highways’ overall capital funding includes a central risk reserve (CRR) that the company holds separately to the core funding provided by government for delivering the capital programmes in RIS2. The CRR provides for portfolio risks and other risks not covered as part of base funding. It is split into allocations for enhancements, renewals and RIS3 development.
Figure A.8: Changes in CRR provision in RP2 (£ million)
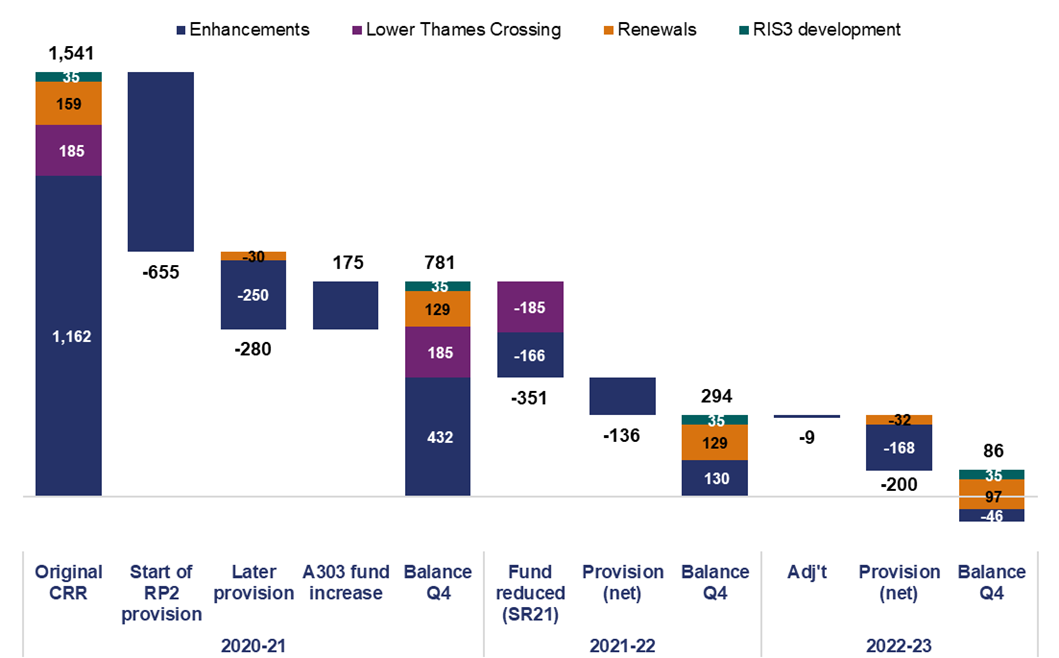
A.32 At the start of RP2, the CRR contained £1,541 million. During the first two years the overall balance was reduced to £294 million (£130 million for enhancements, £129 million for renewals, £35 million for RIS3 development). This was due to both government agreed increases/decreases in the reserve consistent with changes to funding of the enhancements portfolio, and National Highways using the CRR for making risk provisions into its base funding. The provisions shown in Figure A8 represent a net position of funding transferred from the reserve to base funding and funding transferred from base funding back into the reserve (where a saving has been made).
A.33 In our last annual assessment, we highlighted our concern about the balance remaining in the reserve for enhancements in particular. In the current reporting year, National Highways made a £9 million adjustment correcting a reporting error in the previous year and against a backdrop of high inflation, provisioned a further £200 million (£168 million for enhancements and £32 million for renewals). This leaves an overall balance of £86 million with the enhancements element overallocated by £46 million. During the year the company implemented changes to its internal processes for approval of provisions from the reserve and no provisions have been made from the reserve in the second half of the year. It has also introduced improvements to its regular CRR reporting to ORR and DfT. This was in response to an ORR commissioned review of CRR published in July 2022.
A.34 The CRR balance remains a concern despite the risk of further enhancement planning approval delay, see paragraphs 2.19 to 2.23 for further details, meaning CRR pressure could reduce over time. The changes to RIS2 scheme schedules announced by the Secretary of State in March 2023 are unlikely to improve the CRR position as they do not currently have any CRR allocated to their baselines. However, the deferral of RIS3 development schemes to RP4 could mean RIS3 development allocated CRR being available to manage wider enhancements pressures.
Total outturn capital forecast expenditure for enhancements
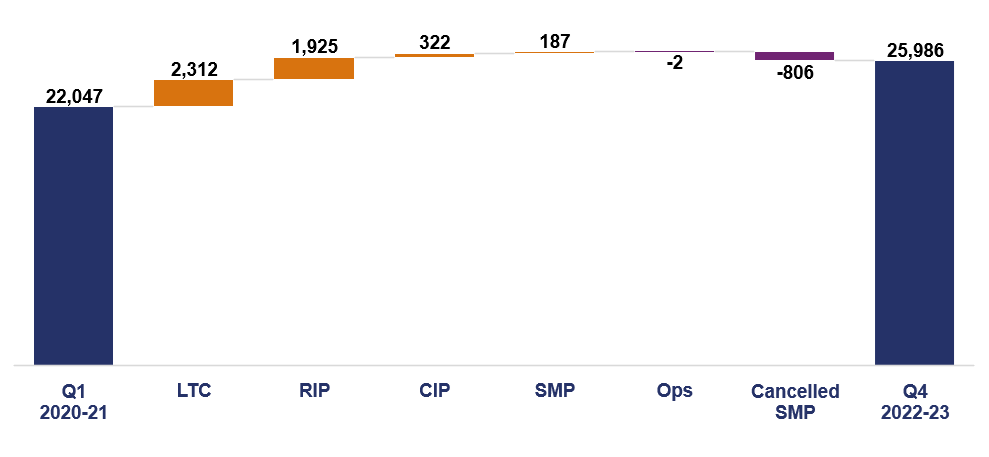
A.35 The total forecast outturn cost of RIS2 enhancements is £28,613 million, comprising £25,986 million for enhancement schemes and £2,627 million for other enhancements. This has increased by £4,969 million (21%) since the start of RP2. £3,225 million was in the past year.
A.36 Figure A9 shows that the forecast costs have increased across most of the programmes, with the exceptions of Operations, that has decreased by £2 million, and the Smart Motorway Programme schemes that were cancelled that had an original forecast value of £806 million.
Figure A.9: Change in total outturn forecasts by programme since the start of RP2 (£ million)
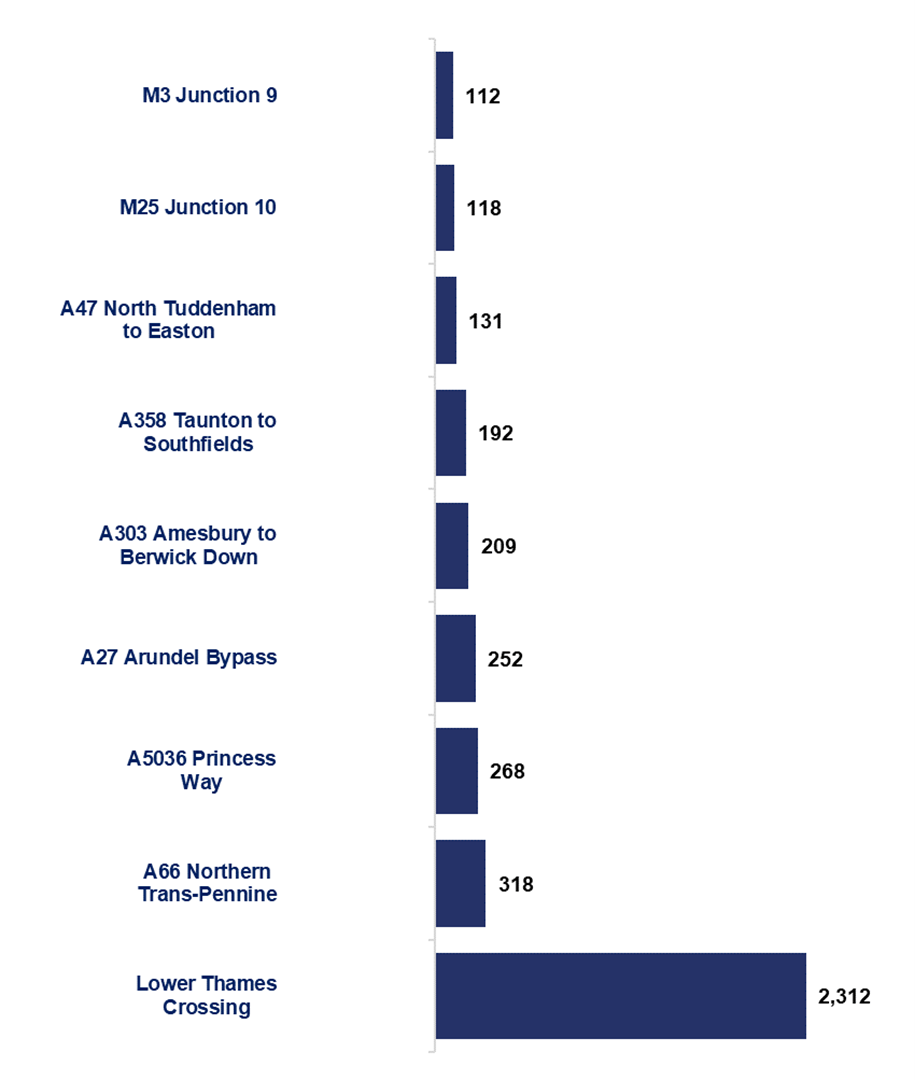
A.37 Figure A10 shows the individual schemes with the largest change in total outturn forecast since the start of RP2 compared to the end of the reporting year. The largest change is related to the Lower Thames Crossing scheme. This increased by £2,312 million.
A.38 There are also three schemes where the forecast total outturn has reduced by greater than £100 million since June 2020. This mostly relates to smart motorway schemes that government announced it would cancel in April 2023.
Figure A.10: Increase in total outturn forecast from April 2020 to March 2023 for schemes where variance is over £100 million (£ million)
Delegated expenditure controls
A.39 Delegated expenditure controls are the financial controls that National Highways is required to have in place to reflect its delegated authority to incur expenditure on behalf of DfT.
A.40 DfT confirmed in March 2023 that National Highways is no longer required to produce a self-assessment of its delegated expenditure controls. As such the role for ORR to review the self-assessment has also been removed. This is in recognition of the fact that the original requirement was set at a time when the company was new and had yet to build its capacity and capability in this area. DfT note that ORR’s annual assessments were a critical part of ensuring that NH took the necessary actions to develop and establish the appropriate internal systems and controls.
Detailed efficiency evidence assessment
A.41 This section provides greater detail on our assessment of the quality of evidence National Highways provided to support its reported efficiency.
Table A.2: Embedded efficiency reported and our assessment of supporting evidence
| Expenditure categories | Reported cumulative (£496 million) | Primary: outputs and funding | Secondary: activity metrics | Secondary: case studies |
|---|---|---|---|---|
| Capital enhancements | £52 million | Good evidence | Good evidence | Good evidence |
| Capital renewals | £182 million | Developing evidence | Good evidence | Good evidence |
| Operations and business costs (capital expenditure) | £76 million | Good evidence | Developing evidence | Developing evidence |
| Operations and business costs (operational expenditure) | £186 million | Good evidence | Developing evidence | Good evidence |
Embedded efficiency: primary evidence
A.42 Within the enhancements expenditure category, National Highways reports efficiency for enhancements schemes based on when they open for traffic. For other enhancements (and all other areas of spend) the position is assessed based on cumulative spend compared to funding at the end of the year. Use of the CRR funding is allowable in evidence of delivering RIS outputs for funding. However, any inefficient use of the CRR (e.g. for poor contractor performance) creates a risk of remaining RP2 funding being insufficient to deliver the required outputs, meaning it would need to find additional efficiency to do so.
A.43 The cumulative £52 million reported for enhancements is £19 million above the cumulative milestone and includes an inflation adjustment of £61 million. Before application of the inflation adjustment, £48 million of efficiency is from schemes that have opened for traffic, offset by £58 million of inefficiency on other enhancements. The evidence provided has improved during the reporting year and supports the reported value.
A.44 To date in RP2, National Highways has delivered more than its planned profile of renewals on the key assets of asphalt pavement, steel restraints and significant structures. However, it has underdelivered concrete pavement due to delivering more life extension in place of some planned full reconstruction and it has delivered less concrete restraints than its planned profile.
A.45 National Highways overspent its budget and adjusted the reported efficiency on this basis. However, the company has not made an inflation adjustment or an adjustment for over- or under-delivery of outputs. It has begun to consider how these can be reflected in its efficiency reporting, but with only two years remaining in RP2 it is important for this to be resolved in the coming year.
A.46 On operations and business costs (capital expenditure), National Highways reported efficiency £17 million above its planned cumulative level which includes an inflation adjustment of £24 million. The company has reduced its reported efficiency by £12 million to reflect timing effects where projects have been delivered later than in its efficiency plans. The evidence provided has improved during the reporting year and supports the reported value.
A.47 For expenditure on operations and business costs (operational expenditure), National Highways reported efficiency marginally above its milestone due to a small underspend in this category. The company raised more income and spent below funding on PFI routes and used this to cover increased maintenance costs. The evidence provided supports the reported value.
Embedded efficiency: secondary evidence
A.48 National Highways has continued to extend the scope of its activity metrics as secondary evidence for renewals and enhancements:
- For enhancements, the company has well established activity metric models for reporting smart motorway and Regional Investment Programme bypass and widening schemes. It is extending this junction improvement schemes in the coming year. We would like to see this work taken further to more clearly show how it supports the level reported using primary evidence.
- For renewals, the company’s activity metric models show it is delivering more efficiency at a level comparable to that shown in primary evidence.
- For operations and business costs (operational and capital expenditure), use of activity metrics is challenging due to the diverse activity in these categories. In previous years National Highways has stated this evidence is not available. However, in this reporting year National Highways has made progress exploring with us whether there are any areas of its expenditure where they can be applied.
A.49 The case studies presented by National Highways in RP2 provide supporting secondary evidence for the embedded efficiency reported. The company presented case studies supporting enhancements, capital renewals, operational expenditure and non-roads capital expenditure. The studies cover a wide range of initiatives taking place in RP2.
A.50 For non-roads capital expenditure, the value of case study secondary evidence presented is significantly below the reported efficiency. We will press National Highways to improve secondary evidence and assess it closely throughout RP2 to ensure it appropriately supports the primary reported value.
A.51 For enhancements, the value of case study secondary evidence includes a large proportion of efficiency initiatives that are below the threshold for formally reporting a case study to ORR. In time we expect some of these efficiencies to increase in size and to form part of the total case studies by the end of the road period and the proportion of below the threshold initiatives to decrease.
A.52 Some of the case studies presented are repeatable initiatives that are utilised across several different schemes. The values for these initiatives are generated using the same assured process to ensure consistency in the recognised efficiency. We review a selection of these calculations to understand the build-up of efficiency. We will continue to do this in the final two years of the road period.
Table A.3: Measured efficiency reported and our assessment of supporting evidence
| Reported cumulative (£353 million) | Primary: case studies | Secondary: outputs and funding | Secondary: activity metrics | |
|---|---|---|---|---|
| Carry-over | £262 million | Good evidence | Not applicable | Not applicable |
| RP2 generated | £91 million | Good evidence | Not available in the reporting year | Developing evidence |
Measured efficiency: primary evidence
A.53 National Highways’ £262 million carry-over efficiency is supported by case studies and efficiency guides presented in RP1. The company has undertaken ongoing assurance of the reported efficiencies and it has updated some of the values (relating to RP2) where appropriate. We continue to review the company’s reported efficiencies for RP2 to understand the reasons for any variances.
A.54 National Highways reported £91 million of cumulative RP2 generated efficiencies this reporting year. This is evidenced by case studies across several themes. So far in RP2, the value of case studies we have reviewed is in-line with the reported efficiency. This is an improvement on the previous year. We will continue to review case studies presented by the company in the final two years of the road period.
Measured efficiency: secondary evidence
A.55 National Highways has engaged positively in the reporting year to identify potential opportunities for secondary evidence to support RP2 generated measured efficiency. The company has started to explore the way that existing activity metrics could be applied to the schemes that fall within the scope of the RP2 generated category. We will continue to work with it in this area.
A.56 Due to the impact of delay and change to the largest schemes in the portfolio in the reporting year there is difficulty in meaningfully using outputs and funding as secondary evidence for RP2 generated efficiency. However, we will continue to explore this in the next reporting year.