Maintenance
C.1 National Highways has a legal duty under the Highways Act 1980 and its licence to maintain the strategic road network (SRN). Maintenance is split into two budget categories:
- routine cyclical and reactive work to keep users safe and the network serviceable (resource); and
- renewal of life-expired assets (capital).
C.2 Table C1 shows a summary of the key performance indicators (KPI) and performance indicators (PI) that the company reports against each category in the second road investment strategy (RIS2). From 1 April 2022 to 31 March 2023 (the reporting year) the capital maintenance and renewals budget was £926 million, and the resource operation and maintenance budget was £420 million.
Table C.1 Maintenance categories
| Maintenance type | Primary reporting source |
|---|---|
| Capital maintenance and renewals – renewal of assets | Renewals delivered against annual commitment Capital budget expenditure |
| Resource operations and maintenance – fixing defects, for example, potholes routine maintenance, for example, cleansing drainage systems, and inspections | Maintenance performance statement (defects, cyclical and reactive maintenance, inspections) Resource budget expenditure |
Maintenance activity performance
C.3 Table C2 details how National Highways’ performance delivering winter services, collecting litter, and undertaking cyclical reactive maintenance has changed since reporting year 31 March 2020 to 1 April 2021. In the reporting year, National Highways reported a similar maintenance activity performance compared to the previous year, noting a marginal improvement in its cyclical maintenance performance.
Table C.2 Summary of National Highways’ maintenance activity performance between April 2020 and March 2023
| Maintenance Activity | Activity Description | 2020-21 (%) | 2021-22 (%) | 2022-23 (%) |
|---|---|---|---|---|
| Winter service | The percentage of precautionary salting delivered within time | 100 | 99 | 100 |
| Winter service | Percentage of instances where running lanes were available | 100 | 100 | 100 |
| Litter | Percentage of planned litter clearance activities undertaken | 95 | 92 | 92 |
| Cyclical maintenance (AD areas only) | Percentage of cyclic works that are completed within the required timescales | 77 | 79 | 83 |
| Reactive maintenance (AD areas only) | Percentage of reactive, less than 24 hour works that are completed within the required timescales | 91 | 93 | 93 |
Defect management
C.4 An indicator of maintenance performance is how promptly National Highways addresses defects such as potholes. Table C3 and C4 summarise defect performance since April 2019. Two categories of performance are provided:
- the percentage of high priority defects addressed within 24 hours; and
- the percentage of other defects addressed within the required timescale for that defect type.
C.5 In the second year of RP2 National Highways merged some of the defect type categories that it reports performance against to align with its revised data standards. Table C3 shows the gaps in performance data that have emerged as a result, where those applicable to Asset Delivery (AD) areas are noted.
C.6 National Highways reported that the company’s performance has deteriorated failing to address both high priority and normal defects across most defect types within the required timescales.
C.7 National Highways indicated that the impact on the SRN as a result of deteriorating maintenance performance is due to issues in transferring to the Asset Delivery contract model.
Table C.3 Summary of National Highways' priority (within 24 hours) defects performance between April 2019 and March 2023
| Defect type | 2019-20 (%) | 2020-21 (%) | 2021-22 (%) | 2022-23 (%) |
|---|---|---|---|---|
| Paved area (road surfacing) | 90.6 | 94.7 | 94.8 | 85.6 |
| Road markings and road studs | 93.5 | 95.1 | Not applicable | Not applicable |
| Traffic signs, road markings and road studs | Not applicable | Not applicable | 95.6 | 89.6 |
| Vehicle restraint systems (safety barriers) | 95.0 | 92.7 | 93.8 | 93.9 |
| Lighting | 81.1 | 89.8 | 91.5 | 80.9 |
| Signage | 89.0 | 93.1 | Not applicable | Not applicable |
| Soft estate (AD areas) | 90.3 | 90.9 | 94.9 | 86.9 |
| Reactive sweeping and cleaning actions (excluding graffiti) (AD areas) | 96.9 | 97.4 | Not applicable | Not applicable |
| Sweeping and cleaning – offensive graffiti | 100.0 | 80.0 | Not applicable | Not applicable |
| Sweeping and cleaning (including offensive and non-offensive graffiti) | Not applicable | Not applicable | 93.1 | 83.0 |
| Fences and walls | 91.2 | 97.7 | 96.0 | 91.0 |
| Drainage and service ducts (AD areas) | 91.1 | 94.0 | 94.3 | 84.2 |
| Geotechnical (AD areas) | 83.3 | 100.0 | 99.4 | None reported |
| Structures (AD areas) | 85.1 | 98.3 | 92.5 | None reported |
Table C.4 Summary of National Highways' non-priority defect performance between April 2019 and March 2023
| Defect type | 2019-20 (%) | 2020-21 (%) | 2021-22 (%) | 2022-23 (%) |
|---|---|---|---|---|
| Paved area (road surfacing) | 85.6 | 95.4 | 94.5 | 85.7 |
| Road markings and road studs | 77.4 | 93.4 | Not applicable | Not applicable |
| Traffic signs, road markings and road studs | Not applicable | Not applicable | 91.5 | 84.8 |
| Vehicle restraint systems (safety barriers) | 77.7 | 93.0 | 89.1 | 85.3 |
| Lighting | 84.3 | 86.3 | 88.9 | 78.3 |
| Signage | 81.7 | 93.5 | Not applicable | Not applicable |
| Soft estate (AD areas) | 75.8 | 87.7 | 85.1 | 88.9 |
| Reactive sweeping and cleaning actions (excluding graffiti) (AD areas) | 90.0 | 95.1 | Not applicable | Not applicable |
| Sweeping and cleaning – offensive graffiti | 78.3 | 95.6 | Not applicable | Not applicable |
| Sweeping and cleaning (including offensive and non-offensive graffiti) | Not applicable | Not applicable | Not applicable | 86.9 |
| Fences and walls | 79.4 | 95.1 | 93.3 | 86.1 |
| Drainage and service ducts (AD areas) | 69.5 | 91.0 | 87.3 | 62.5 |
| Geotechnical (AD areas) | 77.3 | 100.0 | 94.9 | 100.0 |
| Structures (AD areas) | 75.3 | 96.2 | 93.1 | 90.2 |
Insurance claims processing
C.8 Green and red claims are insurance claims against motorist or their insurers, or against National Highways. They provide an indication of the company’s performance against its statutory obligations and how well it is recouping financial loss:
- Green claims occur where the SRN has been damaged by a road user, for example from a collision, and the company needs to recoup costs to repair the asset damage; and
- Red claims are processed where a loss has occurred to a road user as a result of the company not meeting its requirements to maintain highway and the company pays out for the loss.
C.9 Tables C5 and C6 provide a summary of the number of claims and number of settled claims of each type. In the reporting year National Highways recorded a 75% and 27% increase in red and green claims, respectively from the previous reporting year. Furthermore, the company reported an 18% and 14% decrease in red and green settled claims, respectively from the previous reporting year.
Table C.5 Total number of National Highways' claims between April 2018 and March 2023
| Claim type | 2018-19 | 2019-20 | 2020-21 | 2021-22 | 2022-23 |
|---|---|---|---|---|---|
| Red claims | 2,239 | 1,751 | 1,284 | 1,198 | 2,097 |
| Green claims | 4,937 | 3,906 | 5,155 | 6,898 | 8,762 |
Table C.6 Total number of National Highways' settled claims between April 2018 and March 2023
| Claim type | 2018-19 | 2019-20 | 2020-21 | 2021-22 | 2022-23 |
|---|---|---|---|---|---|
| Red claims | 992 | 394 | 764 | 512 | 419 |
| Green claims | Not available | 706 | 3,848 | 7,420 | 6,397 |
Asset inspection performance
C.10 Inspection performance shows that National Highways is meeting its requirements to inspect the SRN and gives us assurance that the asset performance that the company reports under its key performance indicators and performance indicators is based on accurate, timely condition data. Table C7 provides a summary of National Highways’ planned inspection performance.
C.11 National Highways improved the percentage performance of inspection programme completed for structures, safety barriers, and traffic signs and technology. Lighting and geotechnical inspections reduced. The company reported that its reduced performance in lighting is due to outstanding inspections in South East, South West and North West, with those regions identifying actions to resolve this. Reduced performance in geotechnical inspections is due to outstanding inspections in South East region, with the company reporting a plan is in place to ensure these are completed by the end of June 2023. We will scrutinise National Highways inspection performance in completing outstanding inspections.
Table C.7 Summary of planned inspections that National Highways completed between April 2019 and March 2023
| Asset type | 2019-20 (%) | 2020-21 (%) | 2021-22 (%) | 2022-23 (%) |
|---|---|---|---|---|
| Structures | 92.2 | 97.0 | 92.0 | 96.5 |
| Vehicle restraint system (safety barrier) | 79.4 | 84.7 | 88.0 | 90.9 |
| Lighting | 66.3 | 116.0 | 89.0 | 76.7 |
| Geotechnical | 82.8 | 95.0 | 101.0 | 88.4 |
| Traffic signs and technology | 92.3 | 85.0 | 101.0 | 107.9 |
Renewals
Asset renewal delivery
C.12 National Highways’ 2022 delivery plan set out the volumes of renewals work it planned to deliver during the year. The company reports renewals work under two categories for the second road period (RP2): routine cyclical renewals; and, work termed major life-extension renewals. Major life-extension renewals include:
- road surfacing – asphalt and concrete;
- safety barriers – steel and concrete; and
- significant structures (such as the refurbishment of bridges with greatest need).
C.13 In the reporting year, National Highways delivered its planned volumes of renewals against all major life-extension assets with the exception of concrete safety barriers, where it underdelivered by 21%. The company has reported this is due to difficulties in agreeing financial sign off with a Design Build Finance Operate (DBFO) organisation for a large scheme in the Yorkshire and North East region; the scheme would have contributed 3,750 linear metres to the renewals reporting for the third year of RP2 resulting in a potential variance of 9%.
C.14 National Highways underdelivered on three routine cyclical asset types. The company reported the following reasons for missing its renewals:
- bridge bearing (-1%) – missed commitment by one bridge bearing;
- waterproofing (-9%) – missed commitment by 2,091 m2 due to a combination of transferring to Asset Delivery model and delays on two schemes, and scope changes to another; and
- technology renewals and improvements (-0.67%) – missed commitment by three technology renewal schemes.
C.15 National Highways reported significant over delivery of kerbs 87% and drainage 85%. The company told us the primary reason for over delivery is due to the secondary benefits of a renewal being realised. For example, some over delivery in kerb renewals is due to East region not identifying the secondary kerb outputs related to concrete roads renewal in its forward programme.
C.16 On average, National Highways delivered within 20% of its plan for all renewal asset types, this is compared to within 18% in the second year of RP2. This demonstrates a similar performance. However, it is important that the company is able to demonstrate adequate planning capability to evidence the right asset intervention is planned and renewed to assure optimum approach to asset management.
Table C.8 Volumes of renewals delivered compared to plan in reporting year
| Type of renewal | Asset renewal description | Planned output | Actual output | Output variance (%) |
|---|---|---|---|---|
| Major life-extension renewals | Safety barriers – steel (kilometres) | 350 | 377 | 8 |
| Major life-extension renewals | Safety barriers – concrete (kilometres) | 13 | 10 | -21 |
| Major life-extension renewals | Road surface – asphalt (lane kilometres) | 1,350 | 1,606 | 19 |
| Major life-extension renewals | Significant structures (number) | 39 | 44 | 13 |
| Major life-extension renewals | Road surface – concrete (lane kilometres) | 77 | 81 | 5 |
| Renewal of roads | Traffic signs (number) | 2,000 | 2,117 | 6 |
| Renewal of roads | Kerbs (kilometres) | 10 | 18 | 87 |
| Renewal of roads | Drainage (kilometres) | 130 | 240 | 85 |
| Renewal of roads | Road markings (kilometres) | 3,300 | 3,665 | 11 |
| Renewal of roads | Guardrail (kilometres) | 0.5 | 0.8 | 56 |
| Renewal of roads | Boundary fencing (kilometres) | 57 | 62 | 10 |
| Renewal of roads | Geotechnical (kilometres) | 1.8 | 2.5 | 37 |
| Renewal of roads | Lighting (number) | 600 | 712 | 19 |
| Renewal of structures | Bridge bearing (number) | 100 | 99 | -1 |
| Renewal of structures | Bridge joint (number) | 350 | 469 | 34 |
| Renewal of structures | Parapet (kilometres) | 4.5 | 5.0 | 11 |
| Renewal of structures | Waterproofing (square metres) | 24,000 | 21,909 | -9 |
| Renewal of technology | Motorway communication equipment (number) | 300 | 353 | 18 |
| Renewal of technology | Technology renewals and improvements (number) | 450 | 447 | -1 |
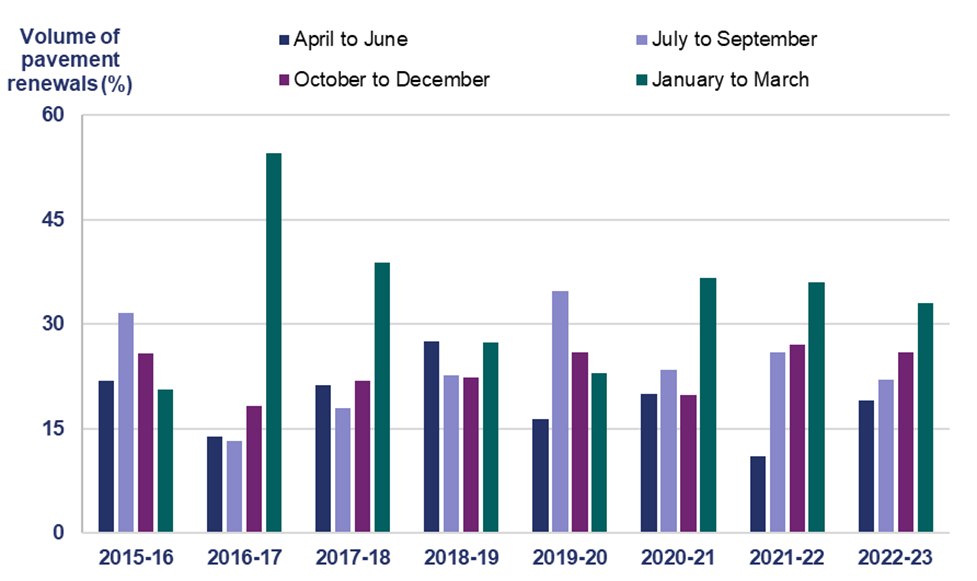
C.17 Figure C1 shows that National Highways delivered the majority of road surfacing (concrete and asphalt) renewals between January 2023 and March 2023; reflecting the same trend of deliver in the first and second year of RP2. We have previously reported that the last three months of the financial year are typically not ideal for undertaking certain types of activity due to unfavourable weather conditions. Furthermore, it does not demonstrate alignment with optimum asset management intervention planning.
Figure C.1 Quarterly volumes of pavement renewals delivered between April 2015 and March 2023