In the reporting year, National Highways delivered more efficiently and has met its March 2023 milestone towards its 2025 target of £2.1 billion. The company is forecasting that it will meet that target. However, efficiency performance for the remainder of the second road period (RP2) is uncertain. National Highways must demonstrate that it has a clear understanding of how to meet its key performance indicator target despite changes in outputs, cost and delivery risks and a challenging enhancements programme for the remainder of RP2.
1.1 National Highways reports that it met its March 2023 cumulative efficiency milestone, after adjusting for inflation above the funded level. During the reporting year we pressed the company to improve the quality of its efficiency evidence and worked with it to ensure that its inflation adjustment is robust. The company has made good progress in these areas and we found that its evidence supports its reported position.
1.2 National Highways has also reported that it is on track to meet its efficiency key performance indicator (KPI) target at the end of RP2. We note that the position is challenging. In the next two years, the level of inflation that the company will face is uncertain, and to meet the target the company will need to deliver a challenging programme of works.
1.3 National Highways must ensure that it has a clear understanding of how inflation is impacting all areas of efficiency and how other external cost pressures (such as non-recoverable VAT) are impacting its business. Following the announced changes to enhancement schemes in March 2023, the efficiency KPI could be revised to reflect adjusted volumes of work. The company must then show us how it will mitigate cost and delivery risks that could impact its second road investment strategy efficiency performance.
Outcome: achieving efficient delivery
1.4 National Highways has one key performance indicator (KPI), two performance indicators (PIs) and a commitment in this outcome area.
1.5 The PIs and commitment are discussed in paragraphs 2.76 to 2.80.
KPI: Total efficiency
1.6 We hold National Highways to account for its delivery of the efficiency KPI target. This includes reviewing and challenging the company on the efficiency evidence that it reports. This chapter summarises the reported position and our view of the quality of the efficiency evidence National Highways has provided.
1.7 National Highways has a target to deliver £2,111 million of capital or operational efficiency during the second road period (RP2). The company sets internal cumulative milestones to track its progress towards achieving its RP2 efficiency target. The internal cumulative milestone for 1 April 2022 to 31 March 2023 (the reporting year) was £776 million.
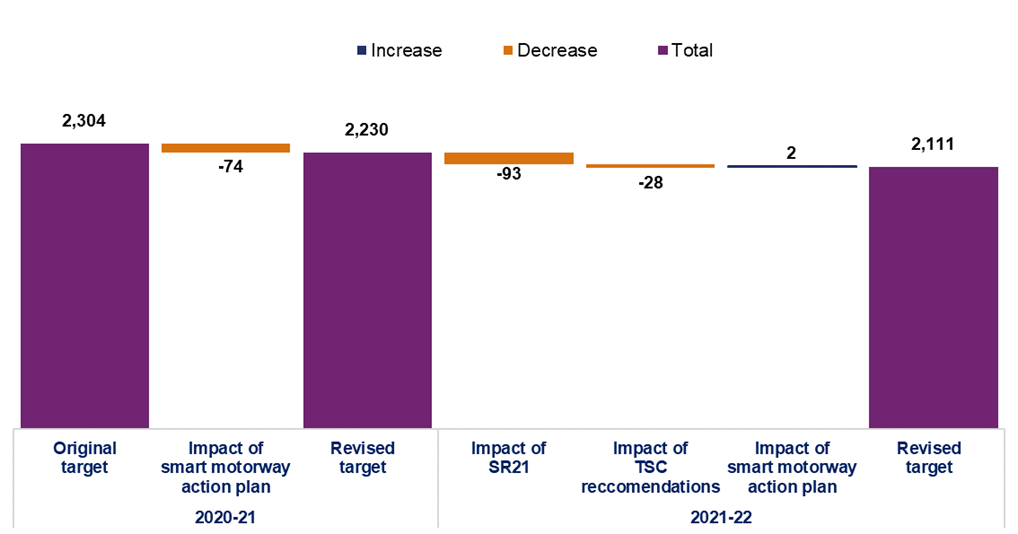
1.8 During the reporting year, government announced changes to the enhancements programme in response to planning delays and inflationary driven financial pressures. These may require a change to the KPI target in the following year. As shown in Figure 1.1 the KPI target was revised earlier in RP2 due to the impact of the smart motorway action plan and Spending Review 2021.
Figure 1.1 Change in efficiency target from start of RP2 (£ million)
National Highways’ reported efficiency over the first three years of RP2
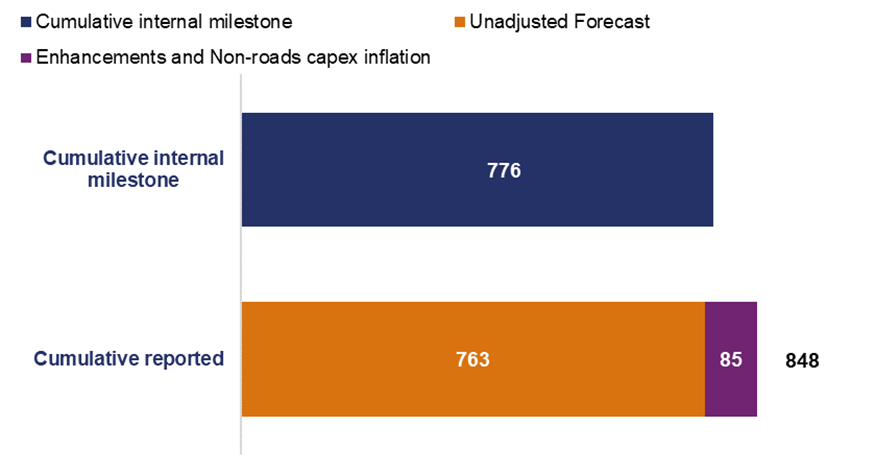
1.9 Figure 1.2 shows that National Highways reported a cumulative efficiency total of £848 million. This includes an adjustment for inflation of £85 million. This represents 40% of the efficiency KPI target and £72 million more than the company’s internal milestone of £776 million. Paragraphs 1.14 to 1.30 set out our assessment of the evidence the company presented.
Figure 1.2 Cumulative reported efficiency against milestone (£ million)
1.10 The reported £848 million of cumulative efficiency is made up of:
- £496 million of embedded efficiency where efficiency is ‘baked-in’ to RIS2 through reduced funding in the original allowance, this value includes the £85 million inflation adjustment for enhancements and non-roads capex;
- £91 million of measured RP2 generated efficiency that does not reduce funding but reduces risk in RP2 or in the third road period (RP3) and beyond; and
- £262 million of measured carry-over efficiency, representing the RP2 element of the first road period (RP1) delivered efficiency.
Case study: Inflation impacts on efficiency performance
National Highways receives funding to deliver the second road investment strategy on a nominal basis. This means it is based on the expected level of cost inflation at the start of the road period. Funding is not revised for actual inflation, so National Highways takes the risk of inflation being different to the expected level.
For National Highways’ reporting of efficiency performance, it is important that the company can demonstrate the impact of inflation on the cost of its activities. This is because changes in cost caused by external factors are not related to its level of efficiency and can distort its reported efficiency performance.
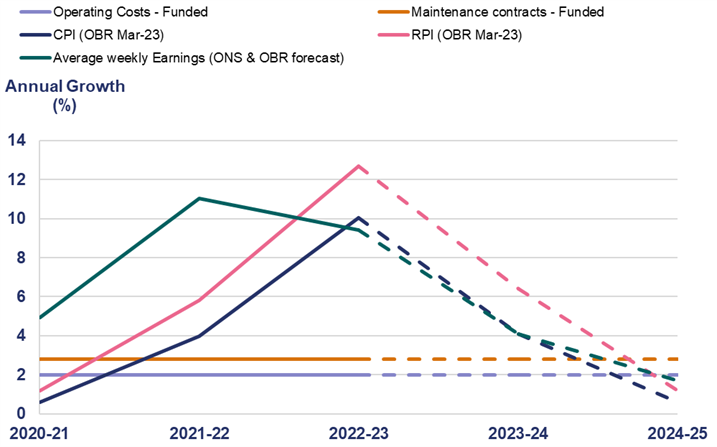
Inflation was lower than the funded level in the first road period (RP1). This created a small ‘tailwind’ benefit. National Highways, to demonstrate that it was delivering efficiently, needed to show it had delivered more outputs than was required in RP1. Figure 1.3 shows that to date in the second road period (RP2), inflation was below the funded level before moving above it in recent years. This ‘headwind’ of higher inflation in RP2 was initially caused by the effects of the Coronavirus (COVID-19) pandemic but in this reporting year a significant driver has been the impact of the war in Ukraine.
The consumer price index is a widely used measure of inflation. It shows how price changes impact the wider economy. However, price changes for National Highways may differ. The company’s supply chain is responsible for much of its operational and capital delivery. The impact of material or labour cost changes may be fully passed on to National Highways or shared between the company and the supplier. Also, the company may not experience the impact of inflation immediately due to the timing of contractual payments.
In RP2 the inflation headwind is materially impacting National Highways’ efficiency performance in the middle of the road period. In early 2022, ORR challenged the company on its reported under delivery against milestones and its RP2 forecast. It produced a detailed model of the impact of inflation on its business. We worked with the company to refine this, challenging its underlying assumptions before it was finalised. As a result, we agreed an adjustment to its reported efficiency performance and forecasts.
Figure 1.3 Real price effects – RIS2 SoFA inflation profile
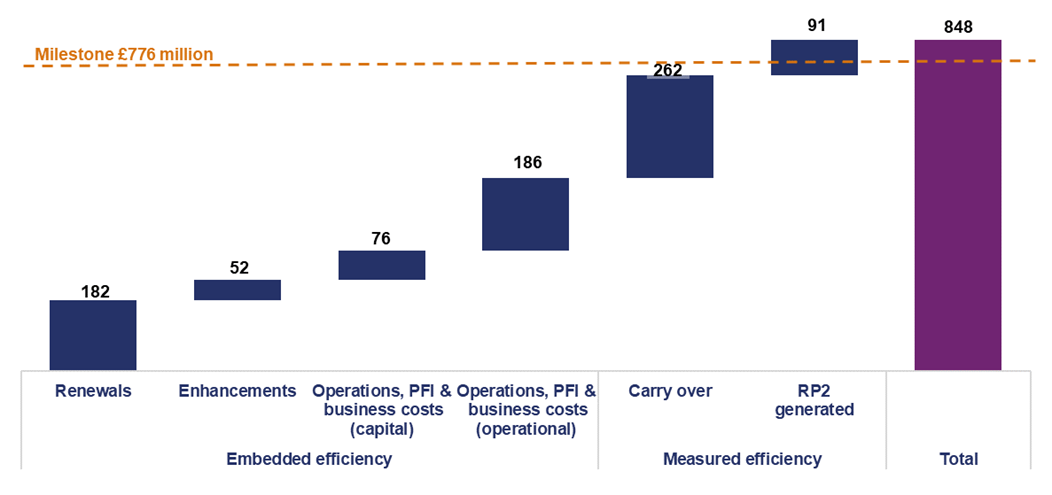
1.11 Figure 1.4 shows the cumulative reported efficiency by category. Reported cumulative efficiency is above the expenditure category milestones when the inflation adjustment is included, except for renewals. However, we track progress and assess National Highways efficiency evidence against the total milestone of £776 million.
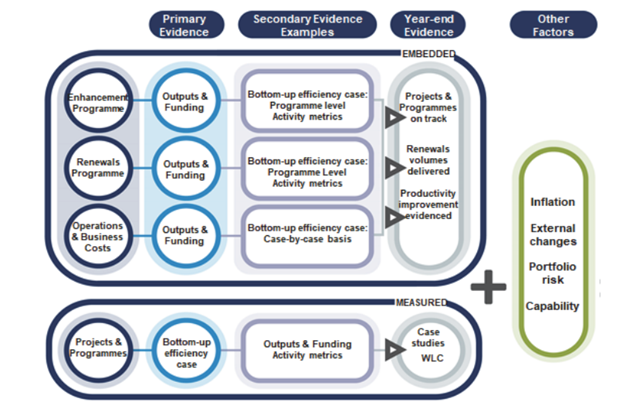
1.12 Figure 1.5 shows the different types of efficiency and the supporting primary and secondary evidence the company presents to support the reported values. National Highways’ Efficiency Report, published annually, provides definitions of types of efficiency, and summarises the evidence for its reported efficiency.
1.13 For embedded efficiency, primary evidence is based on National Highways demonstrating it is delivering the RIS outputs for its post-efficient funding which included the Central Risk Reserve (CRR). Secondary evidence is based on activity metrics (financial measure of a unit of activity) and case-study descriptions of efficiency initiatives. For measured efficiency, case-studies provide the primary evidence. Secondary evidence is based on activity metrics and delivering outputs for funding.
Figure 1.5 Sources of evidence for types of efficiency by expenditure category
1.14 Tables 1.1 and 1.2 show our assessment of the quality of National Highways’ evidence to support the company’s reported efficiency from April 2020 to March 2023. The colours indicate a summary of our view of the evidence quality. Where we indicate there is developing evidence, we believe it requires improvement. Further detailed commentary on our assessment of efficiency evidence can be found in paragraphs A44 to A59.
Table 1.1 Embedded efficiency reported and our assessment of supporting evidence
| Expenditure categories | Reported cumulative (£496 million) | Primary: outputs and funding | Secondary: activity metrics | Secondary: case studies |
|---|---|---|---|---|
| Capital enhancements | £52 million | Good evidence | Good evidence | Good evidence |
| Capital renewals | £182 million | Developing evidence | Good evidence | Good evidence |
| Operations and business costs (capital expenditure) | £76 million | Good evidence | Developing evidence | Developing evidence |
| Operations and business costs (operational expenditure) | £186 million | Good evidence | Developing evidence | Good evidence |
Embedded efficiency: primary evidence
1.15 National Highways has made improvements to the quality of primary evidence supporting its reported efficiency. This includes new reporting on renewal pavement depth suggesting it is delivering road surface renewal at the depth it was funded. We would like to see this reporting developed further in the next reporting year to provide greater assurance about how depth has been calculated.
1.16 National Highways has made less progress with reporting how efficiency values are affected when it delivers either more or less renewals outputs than planned. This is important because reported efficiency is linked to cost variances that may be due to accelerating or decelerating work rather than efficiency.
Embedded efficiency: secondary evidence
1.17 National Highways continues to make progress developing activity metrics for renewals and enhancements:
- For renewals, the company has shown for its five key asset classes that it is delivering efficiency at a similar scale to the level shown in primary evidence.
- For enhancements, it has developed activity metric models for smart motorways and Regional Investment Programme bypass and widening schemes. Work on a model for junction improvement schemes has begun and is expected to report in the coming year.
1.18 For enhancements would like to see this work taken further to more clearly show how it supports the level reported using primary evidence.
1.19 For operations and business costs (operational and capital expenditure) use of activity metrics is challenging due to the diverse activity in these categories. In this reporting year National Highways has begun to explore whether there are any areas of its expenditure where they can be applied.
1.20 National Highways continued to report case studies (descriptions of efficiency initiatives and financial benefits) across all categories of efficiency. The case studies cover a wide range of initiatives taking place in RP2. In some instances, the value of secondary evidence presented continues to be below the reported efficiency.
Table 1.2 Measured efficiency reported and our assessment of supporting evidence
| Reported cumulative (£353 million) | Primary: case studies | Secondary: outputs and funding | Secondary: activity metrics | |
|---|---|---|---|---|
| Carry-over | £262 million | Good evidence | Not applicable | Not applicable |
| RP2 generated | £91 million | Good evidence | Not available in the reporting year | Developing evidence |
Measured efficiency: primary evidence
1.21 National Highways’ carry-over efficiency includes £75 million of smart motorway enhancement efficiencies, as determined by a unit cost model that we reviewed and accepted in RP1. The company will annually update this reported efficiency to reflect any adjustments to efficiency values for the carry-over schemes as they open for traffic within the embedded category.
1.22 National Highways continues to report case studies in support of RP2 generated efficiencies. The value of case studies reviewed this reporting year aligns with the cumulative value reported, an improvement on the prior year.
Measured efficiency: secondary evidence
1.23 In this reporting year, National Highways started to explore how existing activity metrics could be applied to the schemes that fall within the scope of the RP2 generated category. We will continue to work with the company in this area to identify suitable activity metrics to provide robust secondary evidence.
1.24 We are also working with the company to explore the use of outputs and funding as secondary evidence for RP2 generated efficiency.
Other factors: inflation, capability and risk
1.25 National Highways has included an inflation adjustment to account for the external impact on reported efficiency of higher than funded inflation. The reported efficiency is directly related to the costs incurred by the company. So, for the purposes of reporting efficiency, the inflation adjustment reduces the cost and increases the reported efficiency. Therefore, the adjustment ensures that the company’s reported efficiency is not impacted by inflation over which it has no control.
1.26 National Highways believes its efficiency position has been impacted materially by other factors including the Coronavirus (COVID-19) pandemic but has not yet developed a robust case for an adjustment for these.
1.27 National Highways provides an overview in its year 3 efficiency report, due to be published in July 2023, of several capability building change programmes (controlled through its wider Transformation Programme) that it expects to deliver efficiency improvements during RP2. Efficiency case-study evidence provides further detail and, in some areas, quantifies efficiency benefits.
1.28 National Highways improved its reporting on the use of the CRR, funding allocated for portfolio level risks, and made progress showing how it impacts reported efficiency. For further detail on the CRR, see paragraphs 2.72 to 2.75.
Evidence assessment summary
1.29 National Highways improved its efficiency evidence in the reporting year providing increased assurance for its reported position. The company introduced an inflation adjustment and responded constructively to our feedback on the assumptions behind the adjustment. It also worked to improve secondary evidence by widening the scope of activity metrics.
1.30 The evidence taken as a whole is sufficient to support the reported value and achievement of the milestone for years one to three of RP2. However, we want to see National Highways make further improvements to its reporting in the remaining years of the road period, recognising that the efficiency target is back end loaded, and that the company has 60% of the target to deliver in the remaining two years.
National Highways forecast efficiency against its KPI target
1.31 As set out in Figure 1.6, National Highways is forecasting efficiency improvements of £2,216 million across RP2 as a whole. This includes an adjustment for inflation of £368 million. This forecast represents 105% of its efficiency KPI target.
1.32 National Highways notes in its year 3 efficiency report, due to be published in July 2023, that delivering the target requires a comprehensive forecast of costs and outputs through to 2025. The company also highlights that this carries a degree of uncertainty that will reduce as it approaches the end of RP2.
Figure 1.6 Reported forecast efficiency against KPI (£ million)
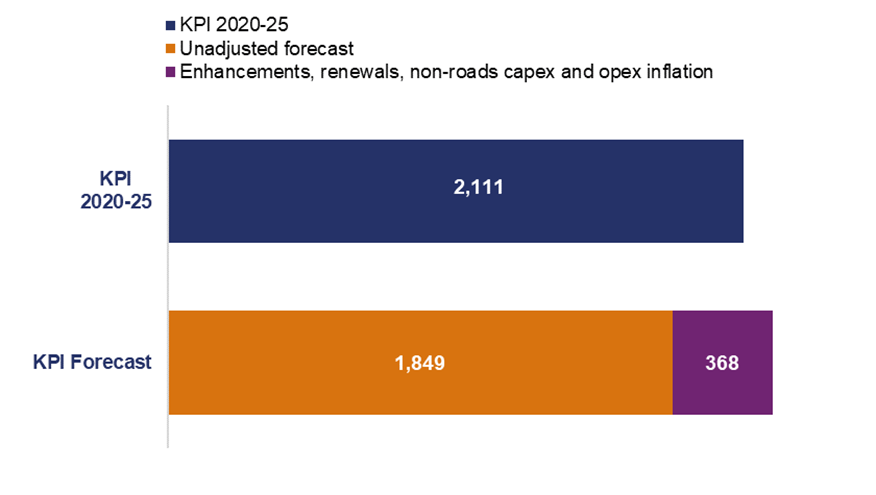
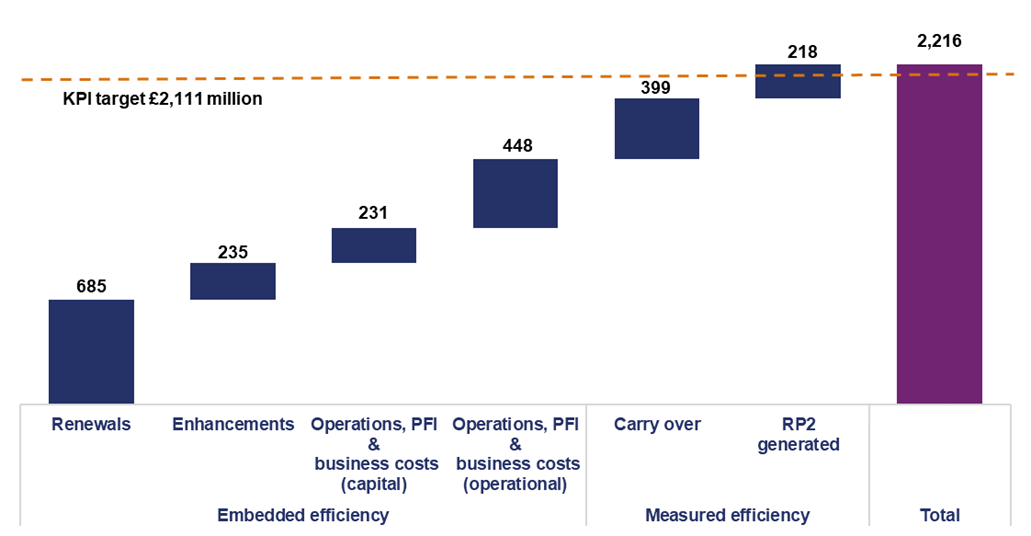
1.33 As shown in Figure 1.7, the reported £2,216 million of forecast efficiency against the £2,111 million target is made up of:
- £1,599 million of embedded efficiency where efficiency is ‘baked-in’ to RIS2 through reduced funding in the original allowance, this value includes the £368 million inflation adjustment applying to each expenditure category;
- £218 million of measured RP2 generated efficiency that does not reduce funding but reduces risk in RP2 or in the third road period (RP3) and beyond; and
- £399 million of carry-over efficiency, representing the RP2 element of the first road period (RP1) delivered efficiency.
Figure 1.7 Reported forecast efficiency against KPI by type (£ million)
Assessment of efficiency evidence RP2 forecast
1.34 In response to ORR challenge in our last annual assessment, National Highways included within its efficiency report a forecast of efficiency against the target for the first time in RP2. In this section we consider the potential impact of change on efficiency and other factors that mean future efficiency performance is uncertain.
1.35 National Highways’ forecast efficiency is made up of three parts. Carry-over efficiency is relatively certain as it is representing the balance of efficiency that began to be delivered in RP1. Embedded efficiency and measured efficiency are more directly linked to the company’s performance in RP2 and are therefore affected by wider factors that could impact the cost or delivery of parts of RIS2.
Change in RIS2 outputs impacting efficiency
1.36 National Highways continued to experience delays to enhancement scheme delivery driven by challenges with achieving planning consent on large complex schemes. In the first two years of RP2, this led to funding, schedule and efficiency target changes. In addition, in the reporting year, inflation has been significantly higher than anticipated for RP2. These factors together are complicating decision making over enhancement schemes that are due to be delivered towards the end of RP2. In March 2023, the Secretary of State announced planned changes to the timescales for three RIS2 schemes.
1.37 National Highways and Department for Transport (DfT) are yet to complete the process for agreeing changes required to the efficiency target. This is expected to be completed in the next reporting year.
1.38 Changes to RIS2 outputs and the efficiency target make forecasting efficiency particularly challenging. This is because, in anticipation of planned/expected changes to RIS2, National Highways will (with government agreement) make decisions impacting cost and delivery timelines that impact efficiency.
External headwinds impacting efficiency
1.39 National Highways adjusted its reported efficiency for its latest assessment of inflation above the funded level for two expenditure categories. The company has made a similar adjustment to its forecast (covering the inflation experienced in the first three years of RP2) but for all expenditure categories. This is because it has not developed sufficient evidence to support inclusion of the adjustment for all categories in its current milestone reporting but is confident that it will do so prior to the end of RP2.
1.40 National Highways only included an adjustment for the first three years of RP2 because enhancement scheme level cost forecasts (and therefore efficiency forecasts) do not yet include the higher inflation expected.
1.41 National Highways reports that it has identified other external headwinds affecting its costs that are not related to efficiency/inefficiency. It intends to develop the case for these further early in the next reporting year and expects to propose further adjustments to the reported position. As with the inflation adjustment we will closely scrutinise any case made to ensure it is robust.
Cost and delivery risk impacting efficiency
1.42 RIS2 funding was set at a level that assumes National Highways will deliver RIS2 outputs and efficiency plans for RP2 based on those outputs. Therefore, if the company cannot deliver RIS2 outputs due to factors within its control, it is unlikely that it will meet the efficiency target.
1.43 National Highways reports that it has missed some of its enhancement commitments to date within RP2. Also, whilst recent cost pressures have reflected higher inflation (outside of the company’s control), cost increases and large enhancement CRR provisions earlier in RP2 (89% allocated by March 2022) indicate there have been cost challenges unrelated to inflation. For further details on remaining enhancement delivery and cost risks, see paragraphs 2.17 to 2.27.
1.44 On renewals, whilst National Highways has delivered its annual planned volumes, for most asset types, it will need to significantly increase volumes for concrete restraints and concrete pavement in the remaining two years to deliver the committed volumes for RP2 as a whole. The company will also need to improve the quality of efficiency evidence.
1.45 National Highways’ efficiency delivery plan is back end loaded because it is linked to enhancement delivery and efficiency being reported only when a scheme opens for traffic. Plans for delivering efficiency were originally set on a programme of work that has since changed during RP2. Changes to timescales and deliverables will inevitably create additional challenges for efficiency that the company will need to recognise and overcome by March 2025.
Summary: Uncertainty in forecast
1.46 National Highways is forecasting that it will meet its target but highlights there is a degree of uncertainty in its reported forecast. We consider there are several factors that add to the challenge the company faces in meeting this target, including change to the target, future inflation, other headwinds and finance/delivery risks for enhancements in particular. We will continue to work with the company on efficiency reporting improvements, ensuring it recognises these risks to the delivery of efficiency and has a clear plan across the business to mitigate them in the remainder of RP2.