5.1 All users of the strategic road network (SRN), whether travelling by car, van, lorry, bus or coach, or by motorcycle or bicycle, on foot, wheeled or on horseback – as well as those who live, work and play alongside it – have expectations that it should meet their particular needs. Consequently, assessing how the SRN delivers for all its users relies on a range of information, indicators and measures.
5.2 This chapter describes how National Highways is performing against key performance indicators (KPI) and performance indicators (PIs) that measure performance across three outcome areas: delivering for road users, fast and reliable journeys, and safety for all.
Outcome: meeting the needs of all users
5.3 National Highways has two targeted KPIs in this outcome area, three PIs and six commitments.
KPI: road user satisfaction
5.4 The Strategic Roads User Survey (SRUS) measures users’ satisfaction with a journey on the SRN within the last 28 days. The survey, managed by the Highways Watchdog, Transport Focus, was conducted face-to-face until it was suspended during the Coronavirus (COVID-19) pandemic. National Highways’ KPI target for road user satisfaction was also suspended at this time.
5.5 Re-instating the user satisfaction KPI target as soon as possible has been a key priority for ORR, the Department for Transport (DfT), National Highways and Transport Focus. In April 2021, Transport Focus introduced an online questionnaire. However, its analysis of the responses indicated that results were not directly comparable to those collected using the face-to-face methodology and the target remained suspended while Transport Focus undertook further development and validation work.
5.6 National Highways’ KPI target for road user satisfaction continued to be suspended for 1 April 2022 to 31 March 2023 (the reporting year) because there was insufficient data to baseline and revise the target. We have worked with key stakeholders to give us confidence that the data from the new survey is stable, comparable, and can be used to set a robust baseline and revised target.
5.7 Following this work, government agreed to set a new user satisfaction KPI target for the company of 73.0% from April 2023 until March 2024. DfT, National Highways, ORR and Transport Focus will review the target level for the final year of RP2.
5.8 In the first year of the re-established target, ORR will continue to evaluate other sources of data to measure user satisfaction and assess delivery of the proposals in National Highways’ annual customer service plan. This continues the approach we have taken since 2020 when the road user satisfaction target was suspended. It draws on four key sources of information:
- SRUS;
- HighView – National Highways’ survey of its customers’ experiences (road user satisfaction);
- evidence from National Highways setting out how it delivered the outputs of its 2022 customer service plan; and
- evidence from Transport Focus’ other user surveys, such as its Logistics and Coach Operators survey.
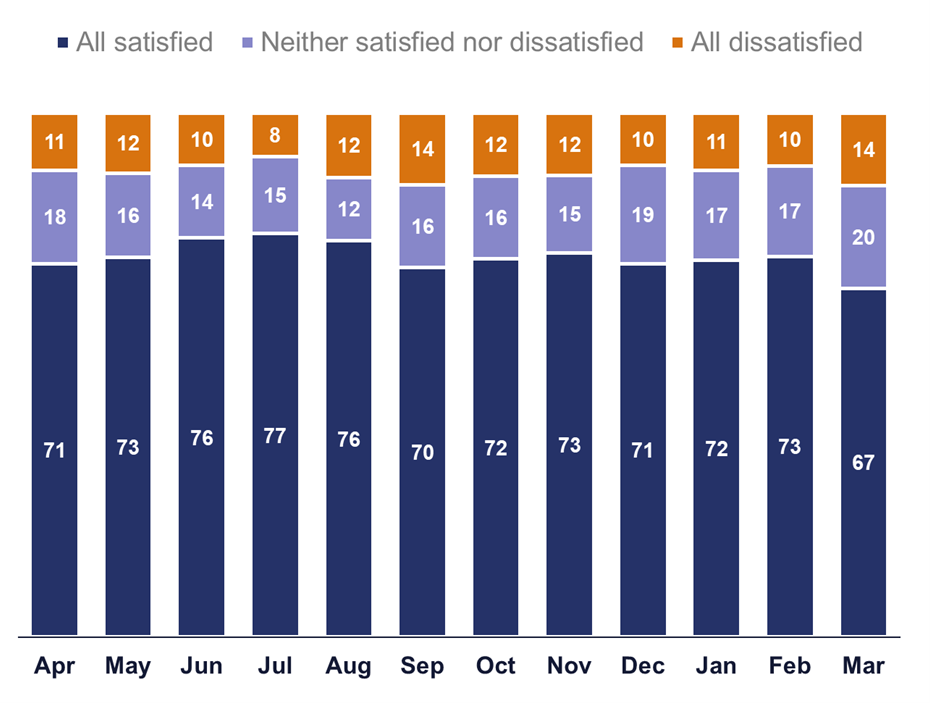
5.9 Figure 5.1 shows the monthly average satisfaction scores of those surveyed using SRUS between April 2022 and March 2023. The percentage of respondents satisfied with their journey varied between 67% in March 2023 and 77% in July 2022. The average for the reporting year was 73%. The percentage dissatisfied with their journey averaged 11% in the reporting year.
Figure 5.1: SRUS road user satisfaction in the reporting year (%)
5.10 HighView is National Highways’ monthly online customer experience survey. It draws from 21,000 responses a year, split equally across the company’s six regions. It provides insight on SRN users’ journey experiences in the four weeks prior to being surveyed.
Figure 5.2: HighView ‘fairly good’ and ‘very good’ customer experience in the reporting year
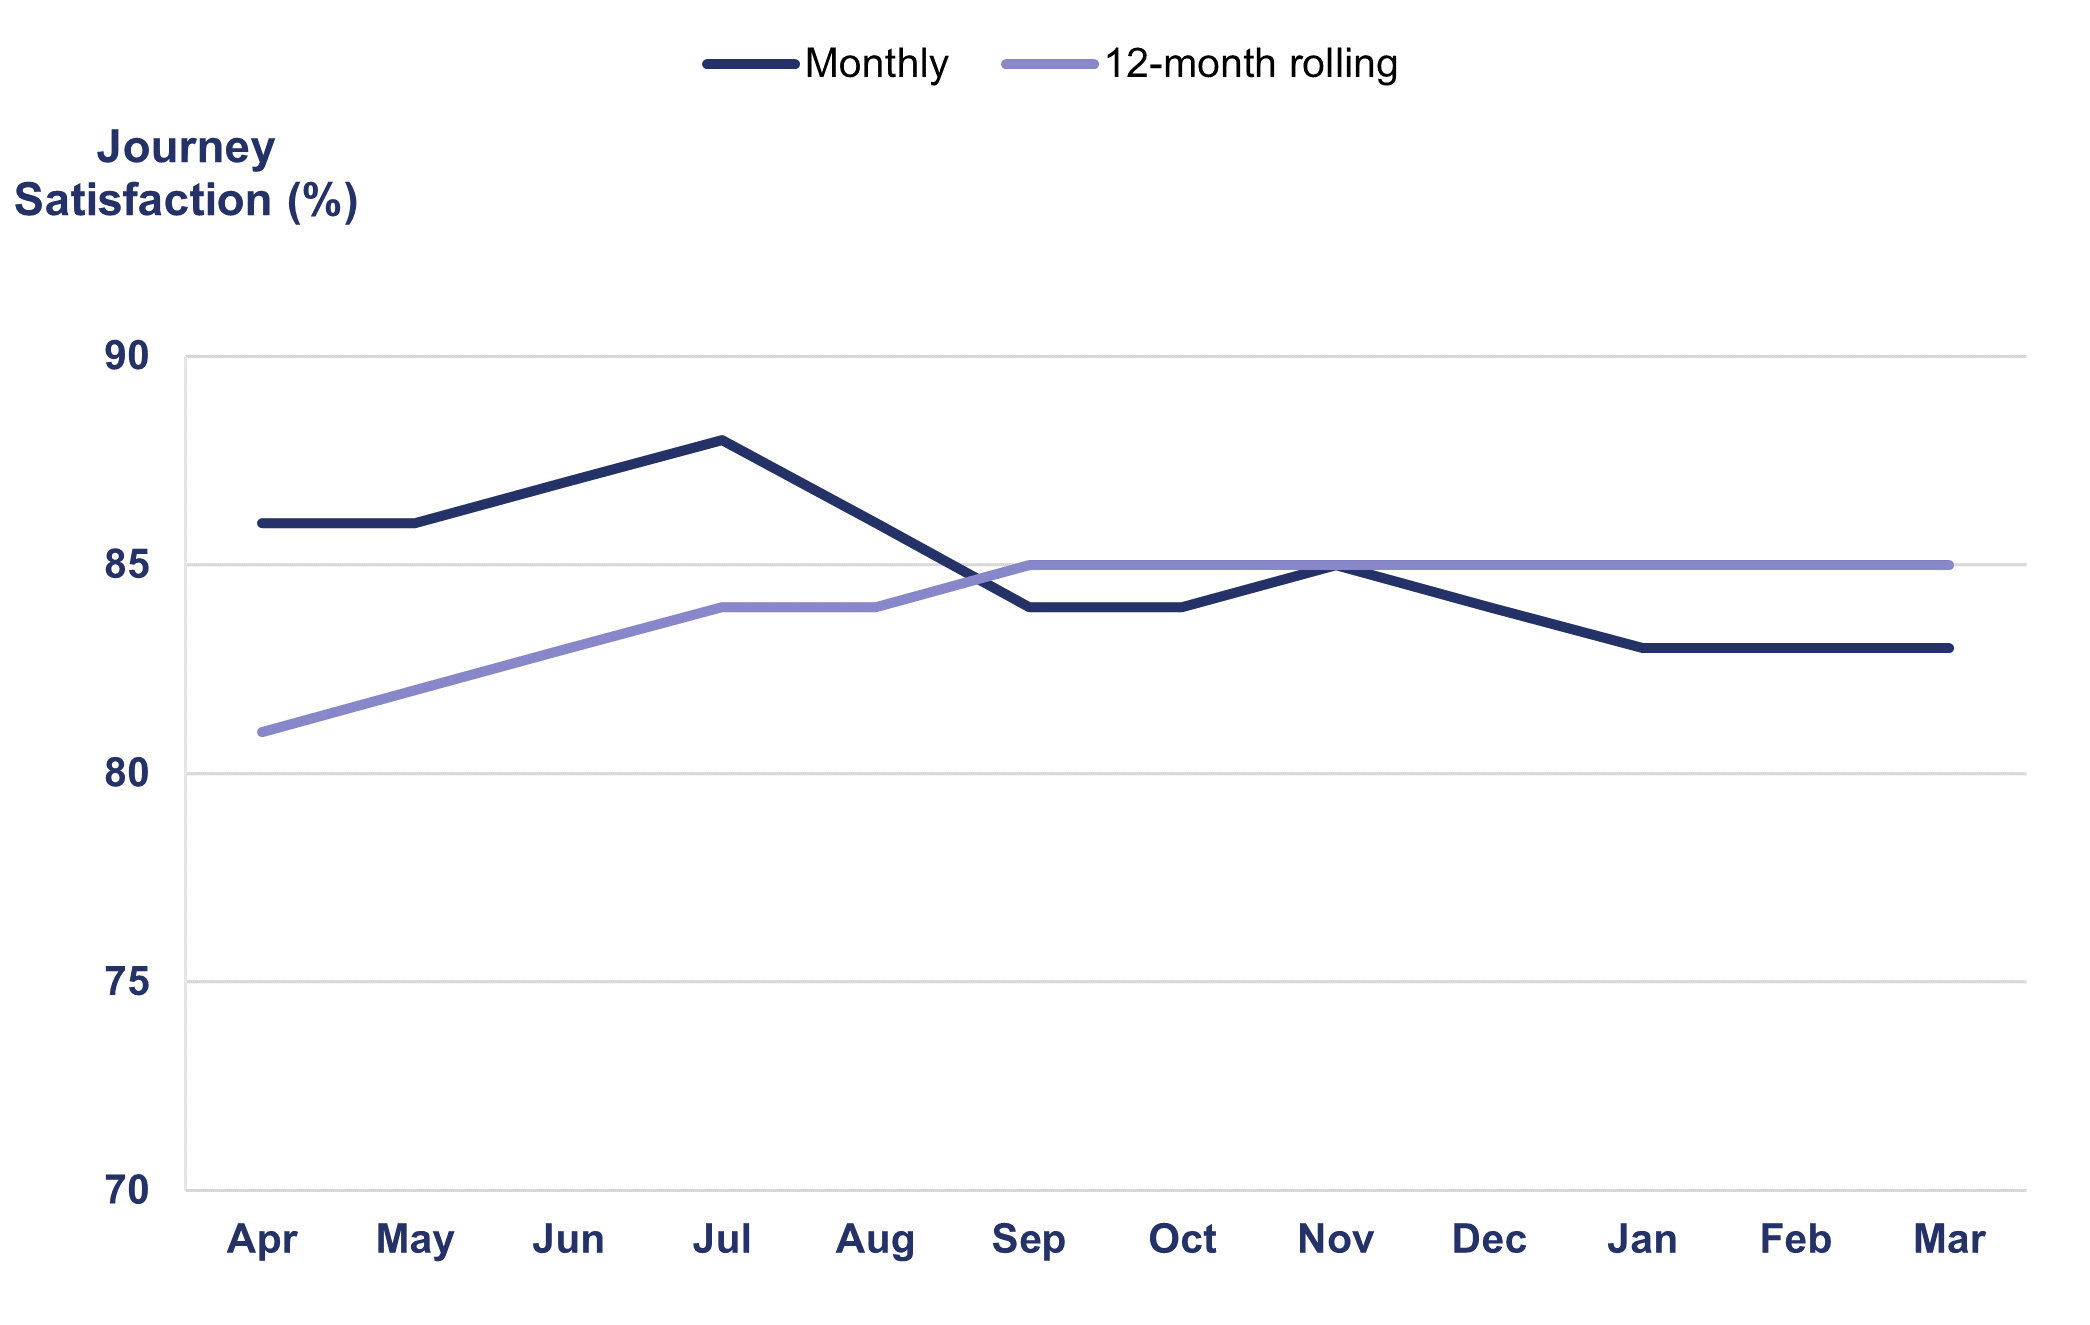
5.11 We used HighView customer experience data to support our understanding of user satisfaction trends while the SRUS target was suspended. As shown in Figure 5.2, the 12-month rolling average percentage of respondents who rated their journey on the SRN as ‘fairly good' or ‘very good’ rose from 81% in April 2022 to 85% in September 2022, where it remained for the remainder of the reporting year. The in-month ratings were more varied. They peaked in July 2022 at 88% before falling to 83% in March 2023.
5.12 SRUS and HighView have different methodologies and purposes, and therefore are not directly comparable. However, when the trends in the two data sets are reviewed alongside each other there is evidence to suggest that National Highways maintained overall journey experience for road users in the reporting year.
5.13 We have tracked delivery of the proposals in National Highways’ annual customer service plan that forms part of the company’s customer service strategy. We met regularly with the company to review its delivery of the outputs. Of the 51 initiatives contained in its plan for April 2022 to March 2023, it delivered 49 (96%) and did not deliver two.
5.14 Initiatives delivered by the company in the latest year included:
- producing a guidance document to reduce the impact of road works;
- undertaking 20 drive-through customer road works audits per month by mystery shoppers at each large project. The score is 50% evidentiary and 50% perception. Each project team is provided with a detailed report and video drive-throughs, allowing them to make improvements;
- awarding, through a road works innovation competition, ten contracts to organisations to test the feasibility of new solutions related to road works; and
- developing ‘customer journey mapping’ to better understand key issues for different user groups such as freight drivers and electric vehicle drivers.
5.15 The two initiatives that National Highways did not deliver in the reporting year, were:
- to develop and start a trial of a major scheme customer experience survey. The company intended that this would help it to better understand the customer experience on individual schemes. No tenders were submitted during procurement to undertake feasibility work. The supply chain fed back that a scheme specific survey was not feasible due to the difficulty of recruiting a robust sample size.
- use insight from freight customers to identify and deliver improvements to three facilities on or near the SRN. The company received bids for improvements from facility operators and told us that it anticipates awarding the first grants by September 2023.
KPI: roadworks information timeliness and accuracy
5.16 National Highways’ target for the end of RP2 is to ensure that 90% of road works involving an overnight closure are accurately notified within seven days.
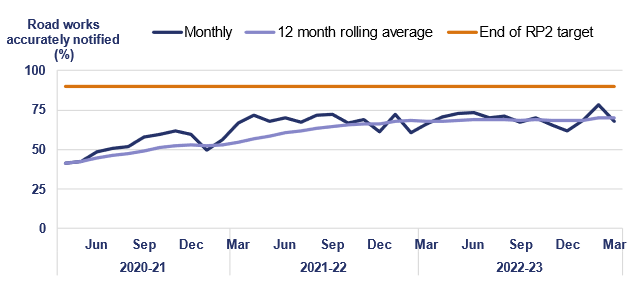
5.17 At the end of March 2023, National Highways accurately notified within seven days 70.0% of road works involving an overnight closure. As shown in Figure 5.3, this is 1.9 percentage points better than the previous year, when 68.1% of road works were accurately notified. It is also 28.4 percentage points better than in April 2020, when the company’s accuracy rate was 41.6%.
5.18 This represents significant progress since the start of RP2, but the end of road period target remains challenging. We expect to see continued effort from National Highways to deliver further improvements and meet its 90.0% target by the end of RP2.
5.19 As National Highways matures as a network operator and assumes full control of its maintenance and renewals activities, we expect to see the company improve its planning of road works and closures. We are working closely with the company to understand its detailed plans to deliver these improvements and meet its end of road period target.
5.20 National Highways reported that performance against this KPI varies across its six regions. Our January 2023 Benchmarking National Highways report sets out further regional detail for the previous reporting year. The company has told us that it is sharing best practice with its regions and updating its processes. The company’s biggest reported contributor to poor performance is where notified road closures are cancelled with less than seven days’ notice. Other factors include late bookings for urgent safety repairs and late starts, where the road closure start time is delayed.
5.21 Around half of the poor performance is for reasons within National Highways’ control, such as booking errors, clashes with other works and contingency bookings. We expect the company to continue to improve its performance in the next reporting year. We will continue to scrutinise its progress.
Figure 5.3: National Highways’ accuracy and timeliness of road works
PIs: meeting the needs of all users
5.22 PIs are untargeted metrics. They enable us to scrutinise more aspects of National Highways’ network performance beyond the headline KPI.
Timeliness of information to road users through electronic signage
5.23 In the reporting year, National Highways took an average (median) time of 2 minutes 20 seconds to set signs and signals on motorways after being notified of an incident. This was nine seconds slower than the previous reporting year average of 2 minutes 11 seconds.
Ride quality
5.24 The ride quality metric is designed to better represent car drivers’ experience of using the road, separate to the pavement condition KPI, see paragraphs 3.7 to 3.12. It is based on the smoothness of the road surface for each ten-metre length of road. In the reporting year, National Highways achieved ride quality satisfaction of 98.6%, an improvement of 0.2 percentage points compared to the previous reporting year.
5.25 National Highways worked with Transport Focus to develop an improved ride quality PI that it implemented from April 2023. We will report against the updated metric in our next annual assessment.
Working with local highway authorities to review diversion routes for unplanned events
5.26 In the reporting year, National Highways engaged with 99.0% of local highway authorities (92 of 93) with an SRN diversion route through their area. This is higher than 97.2% in the previous reporting year and shows National Highways has increased its engagement with local authorities during unplanned events.
Commitments: meeting the needs of all users
5.27 Commitments are priorities that are not suited to metrics, such as developing new metrics, publishing reports on specific performance items or improving reporting for future years.
Review SRUS performance in the previous reporting year to determine targets later in RP2
5.28 Government agreed to set the company a 73.0% target for the next reporting year. In addition, there will be further ongoing data analysis to support setting a target for the last year of RP2, see paragraphs 5.4 to 5.9.
Develop a measure of ride quality that reflects road users’ experience
5.29 This commitment was to develop a measure of ride quality to reflects road users’ experience of the network. National Highways has completed and implemented this commitment, see paragraph 5.26 for more detail.
Investigate expanding the scope of the timeliness of electronic signage information PI
5.30 National Highways started work on this commitment in April 2020. In May 2022, government agreed that the company could cease work as initial data showed that the time to clear signs was the same as the time taken to set signs. This is an existing PI. The company is working with Transport Focus to understand the causes for exceptionally long times to set some signals.
Develop a satisfaction survey for cyclists and pedestrians
5.31 National Highways discussed this commitment with Transport Focus and agreed to develop a qualitative survey. Work on this, including discussions with stakeholders, has continued through the year. In March 2023,Transport Focus published further results of regional surveys of pedestrian, cyclist and equestrian experiences and needs.
Develop satisfaction surveys for logistics and coach managers
5.32 National Highways and Transport Focus developed a logistics and coach manager survey. Transport Focus carries out the survey three times each year, with the results published on Transport Focus' data hub annually in January, May and September.
Investigate expanding the scope of the working with local highway authorities PI
5.33 Government ceased the development of this metric. There is a statutory requirement on National Highways to work with local authorities on planned diversion routes. This meant that the proposed PI reported 100% each month.
Outcome: fast and reliable journeys
5.34 National Highways has three KPIs, five PIs and three commitments in this outcome area.
Traffic levels
5.35 Traffic levels increased in the reporting year. This led to increased delays and reduced journey time reliability compared to the previous reporting year. National Highways’ performance is broadly in-line with where it was pre-pandemic.
5.36 Traffic returned to 98% of pre-pandemic levels in March 2023, up from 94% in March 2022. Freight vehicle traffic continues to be above pre-pandemic levels. Many delay metrics for the SRN report worsening performance as traffic levels increase.
KPI: average delay
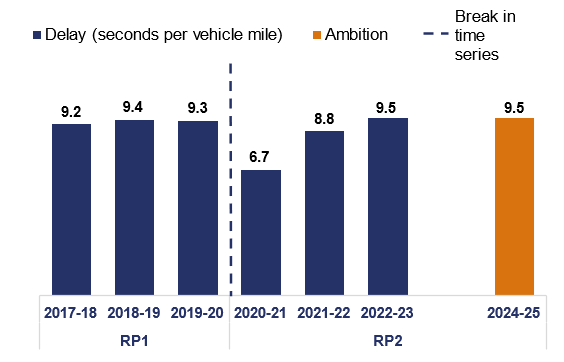
5.37 National Highways has an ambition that average delay on the SRN is no higher than 9.5 seconds delay per vehicle mile at the end of RP2. As shown in Figure 5.4, at the end of March 2023, average delay was 9.5 seconds per vehicle mile. This is worse than the 8.8 seconds per vehicle mile in the previous year but equal to the ambition for the end of the road period.
5.38 In 2021, National Highways published Managing delay on the strategic road network. This document set out the key actions that the company planned to take to ensure that delay was no worse than 9.5 seconds per vehicle mile by March 2025. We continue to scrutinise its progress against these actions.
5.39 National Highways continues to achieve its KPI targets for incident clearance rate and road works network impact, see paragraphs 5.40 to 5.42. These are the two biggest contributors to average delay within the company’s control. We are working with the company to understand other reasons for worsening delay and the actions that it is taking to mitigate them.
Figure 5.4 Average delay on the SRN (seconds per vehicle mile), April 2016 to March 2023
KPI: roadworks network impact
5.40 This KPI measures the impact of road works on road users. It combines:
- the length of road works;
- the amount of time they are in place on the network;
- the number of lanes affected; and
- the type of traffic management in use.
5.41 In the reporting year, road works network impact averaged 42.3 million against National Highways’ target to keep below 47 million. March 2023 was the single month with the highest impact from road works, an in-month score of 52.9 million. At the start of RIS2, the target was agreed to increase in the reporting year due to more enhancement schemes expected to be in construction. However, with delays to many schemes, ORR asked the company and DfT to recalculate an appropriate target for the next reporting year. They have said that they will undertake this work once the effects of enhancements scheme delays are formally agreed.
KPI: incident clearance rate
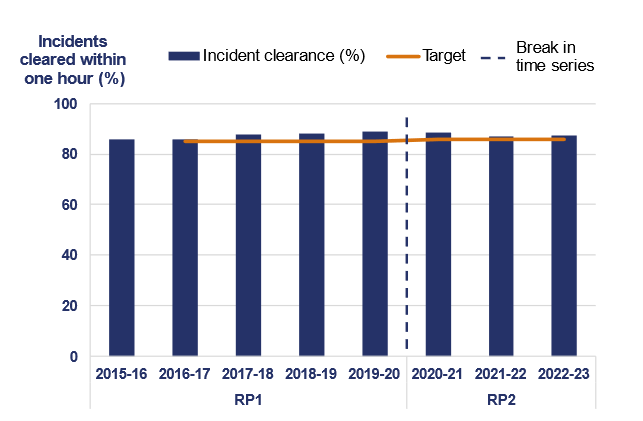
5.42 As shown in Figure 5.5, in the reporting year, National Highways cleared 87.2% of incidents affecting traffic flow on its motorways within one hour. This is better than the RP2 target of 86% and performance in the previous reporting year (87.1%), but worse than the first year of RP2, when it cleared 88.6% of incidents within one hour.
Figure 5.5 National Highways’ incident clearance performance
Case Study: Clearing incidents in a timely manner
In the reporting year, National Highways traffic officers responded to over 74,000 incidents and drove a collective one million miles. The company has a key performance indicator (KPI) target to clear 86% of motorway incidents that result in a live lane closure within one hour of being reported.
Delivery depends on traffic officers and regional operations centre (ROC) staff working effectively together. When an incident is spotted by National Highways staff, the police or a member of the public, a traffic officer is dispatched and ROC staff set electronic signs to alert other road users.
In the reporting year, National Highways has introduced several initiatives and changes to work practices to improve the speed and efficiency of incident clearance, these include:
- Single view of the network: traffic officer managers use a digital tool to locate traffic officers and set patrol routes on the motorway network, to reduce response times to incidents;
- Remote statutory removals: recovery vehicles are deployed closer to a report of a stranded vehicle, so if a traffic officer is unable to move the vehicle, a purpose-built recovery vehicle is nearby to clear an incident; and
- Battery boosters: all traffic officer vehicles carry a device that is able to jump start engines of stranded vehicles in order to move the vehicle to a safer area.
Although National Highways is performing better than target for the incident clearance KPI, it is important that the company continues to innovate and improve its service to road users.
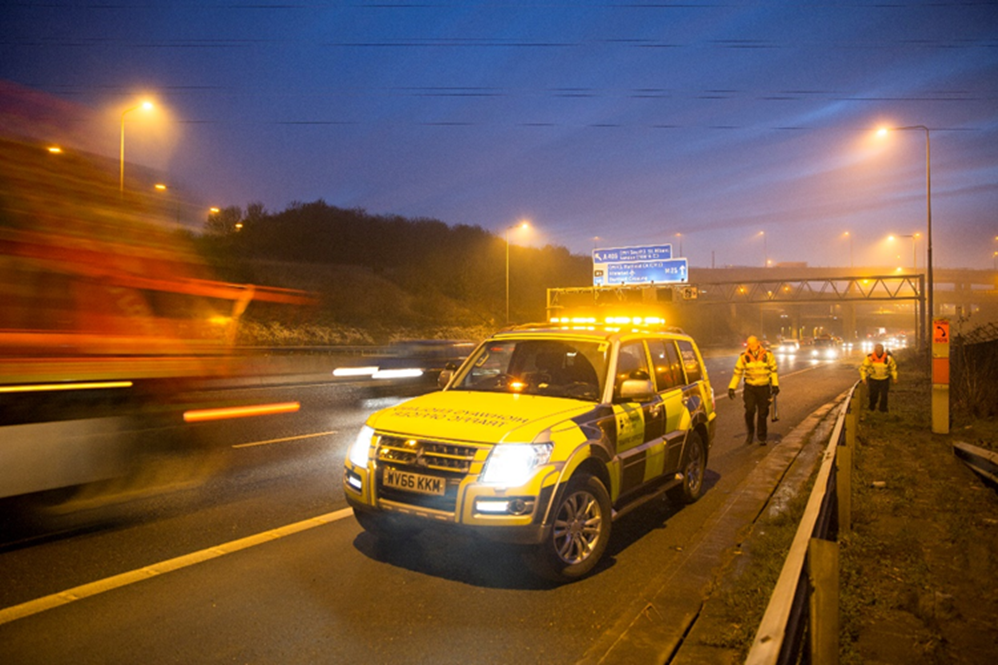
Source: National Highways, traffic officers on the network
PIs: fast and reliable journeys
5.43 The PIs listed show a decline in performance compared to the previous year. In all cases except where noted this is caused by traffic levels recovering year-on-year and approaching pre-pandemic levels.
Average delay on smart motorways
5.44 This PI compares the actual journey time on smart motorways compared to travel time based on the set speed limit at the time. In the reporting year, average delay on smart motorways was 11.2 seconds per vehicle mile. This was higher than the previous reporting year when delay was 9.9 seconds.
Average delay from roadworks
5.45 This PI measures the additional delay caused by road works. In the reporting year, road works added an average 1 minute 20 seconds of delay to journeys per hour travelled. This was higher than in the previous reporting year, when it was 1 minute 12 seconds per hour travelled. A contributing factor may have been more enhancement schemes in construction on the SRN in the reporting year.
Journey time reliability
5.46 This PI measures the difference between actual travel times and the expected travel time including regular congestion. This includes unplanned incidents and additional congestion over and above normal amounts. In the reporting year, reliability was 2.9 seconds per vehicle mile. This was higher than in the previous reporting year, when it was 2.8 seconds per vehicle mile.
Average delay on gateway routes
5.47 This metric measures the average delay experienced by road users on the roads serving airports and ports across England. It is designed to measure the impact of delay on freight. In the reporting year, delay on these roads was 8.8 seconds per vehicle mile. This was higher than in the previous reporting year when delay was 7.9 seconds per vehicle mile.
Average speed
5.48 The average speed of vehicles travelling on the SRN was 57.9 miles per hour in the reporting year. This was slower than in the previous reporting year when average speed was 58.6 miles per hour.
Commitments: fast and reliable journeys
5.49 Commitments are priorities that are not suited to metrics, such as developing new metrics, publishing reports on specific performance items or improving reporting for future years.
Replace existing network availability KPI with a new expanded metric
5.50 National Highways completed this commitment. It has been reporting the new KPI since April 2021.
Investigate the development of new metrics on journey time reliability and delay in roadworks
5.51 National Highways has worked with Transport Focus and consultants to identify new metrics that would make its reporting more accessible to road users. These metrics have been developed and are progressing through validation.
Investigate new PIs on delays from incidents and delays on the SRN/local road boundary and an alternative performance measure for smart motorways operations
5.52 In the reporting year, National Highways completed development of an incident delay metric, with validation due to be completed by July 2023.
5.53 In May 2022, government agreed to cease development of a boundary delay metric. A feasibility study concluded that the new metric would be complex and not provide actionable intelligence. Transport Focus continues to support a measure of user experience at the boundary of the SRN and local road network.
5.54 In the reporting year, National Highways developed a performance measure for smart motorway operations that is now in the validation stage.
Designated funds
5.55 National Highways has four designated funds, assigned a total of £936 million across RP2. The purpose of these funds is to address issues that are of particular importance to road users and stakeholders, beyond the traditional focus of roads investment. The funds are:
- environment and wellbeing;
- users and communities;
- safety and congestion; and
- innovation and modernisation.
5.56 National Highways spent £148 million across its funds in the reporting year, against a revised budget of £165 million. This was an underspend of £17 million. The company reported that while it approved £200 million of projects for delivery in the reporting year, it underspent due to individual project delays and inflationary pressures. The company underspent the innovation and modernisation fund by £32 million, this was offset by smaller overspends in all other funds. Table 5.1 shows the breakdown by individual fund.
5.57 The two projects contributing the most to the underspend were:
- LED programme (environment and wellbeing fund); and
- growth and housing schemes (growth and housing fund from RP1).
Table 5.1: Designated funds budget and spend in the reporting year
| Fund (RP2 total) | Reporting year budget | Reporting year spend | Percentage of annual budget spent |
|---|---|---|---|
| Environment and wellbeing (£410 million) | £66 million | £69 million | 105% |
| Users and communities (£167 million) | £24 million | £26 million | 108% |
| Safety and congestion (£145 million) | £18 million | £28 million | 158% |
| Innovation and modernisation (£214 million) | £57 million | £25 million | 44% |
| Total (£936 million) | £165 million | £148 million | 90% |
5.59 National Highways reports three milestones for each designated fund project:
- feasibility;
- detailed design; and
- implementation.
5.60 Table 5.2 shows that in the reporting year National Highways did not progress designated funds projects through the three milestones as it had planned in April 2022. Less than a quarter of stage gates were complete in the reporting year.
Table 5.2: Designated fund project milestones in the reporting year
| Fund | Milestones planned | Milestones completed |
|---|---|---|
| Environment and wellbeing | 197 | 56 |
| Users and communities | 146 | 27 |
| Safety and congestion | 124 | 29 |
| Innovation and modernisation | 41 | 12 |
| Total | 508 | 124 |
5.61 National Highways has £524 million remaining to spend in the final two years of RP2. This is a significant risk, as the company needs to spend more in the final two years than it has done in the first three years of RP2. The final budget for designated funds is also subject to significant financial uncertainty for National Highways caused by external pressures, such as high inflation.
5.62 In the reporting year, National Highways approved £287 million of funding so far for schemes to deliver in the last two years of RP2, against its remaining budget of £524 million.
5.63 We will continue to scrutinise how National Highways’ progresses and delivers its designated fund projects to ensure that it is delivering them in a timely manner. We are also working with the company to understand how it is monitoring and evaluating its delivered projects and realising the benefits of the designated funds programme.
Outcome: Improving safety for all
5.64 In December 2022, ORR published its first annual assessment of safety performance on the strategic road network. This included the latest data on road casualties that are used to measure National Highways’ performance against its safety KPI and three of its PIs. The rest of this section summarises the headline figures for those KPIs and PIs; the safety report provides further detail. We will update the data in our next annual safety report, to be published by the end of 2023. This will follow DfT’s publication of 2022 road casualty data in September 2023.
KPI: number of people killed or seriously injured on the SRN
5.65 In 2021, 1,857 people were killed or seriously injured on the SRN. This is a 42% reduction from the baseline (2005-09 average) and put National Highways on course to reach its target of a 50% reduction by 2025.
PIs: improving safety for all
5.66 The following PIs are measured using DfT’s road casualty data:
- total number of people killed or injured on the SRN;
- number of non-motorised and motorcyclist users killed or injured on the SRN; and
- number of injury collisions on the SRN.
5.67 The latest position for each of these PIs is reported in our annual safety report that was published in December 2022.
Accident frequency rate for National Highways’ staff and supply chain
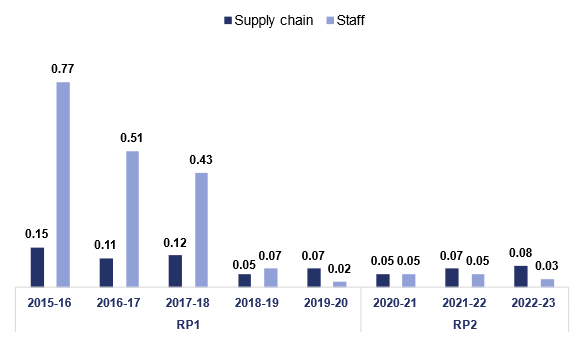
5.68 For National Highways’ staff, there were four RIDDOR (Reporting of Injuries, Diseases and Dangerous Occurrences Regulations 2013) reportable incidents on the SRN in the reporting year. As shown in Figure 5.6, this equates to an accident frequency rate of 0.03 reportable incidents per 100,000 hours worked. This is lower than the previous year when the rate was 0.05.
5.69 For National Highways’ supply chain, there were 28 RIDDOR reportable incidents on the SRN in the reporting year. This equates to 0.08 incidents per 100,000 hours worked. This is higher than the previous year when the incident rate was 0.07.
Figure 5.6: Accident frequency rate for National Highways’ supply chain and staff
Percentage of traffic using iRAP 3-star or above rated roads
5.70 iRAP (international road assessment programme) is a tool to measure how safe a road network is. This is done with a 5-star rating for each section of road. The roads with the highest risk to road user safety are rated one star and roads with the lowest risk are rated five stars.
5.71 Last year we reported that National Highways met and exceeded its RIS1 target to ensure that 90% of travel on the SRN was on roads rated three start or better, using iRAP version 1.
5.72 For RP2, iRAP introduced an updated model (v3.02) that has more demanding requirements for 3-star roads as it includes ten times as many attributes to record, such as pedestrian and cyclist flows.
5.73 National Highways reports that by the end of 2020, 89% of travel on the SRN was on roads rated three stars or better against the v3.02 model. This was an improvement compared to 82% of travel in 2015 that would have been on 3-star roads under that model.
5.74 In the most recent year, National Highways has demonstrated to us how it is developing its use of iRAP data, including tools to better reflect local conditions, and the economic impact of fatal and serious injuries. It is important that the company continues to develop this evidence to support decision making that delivers better safety outcomes.
Commitments: improving safety for all
5.75 Commitments are priorities that are not suited to metrics, such as developing new metrics, publishing reports on specific performance items or improving reporting for future years.
In 2021 establish an iRAP baseline and 2025 forecast, based on latest iRAP methodology
5.76 Last year, we reported that National Highways had met this commitment. The company forecast that 89% of travel in 2025 will be on roads rated three stars or better against the v3.02 model. The company has told us that this is unchanged from the 2020 baseline because it is mostly undertaking network improvements to reduce risks on 3, 4 and 5-star rated roads.
Work with Transport Focus to investigate a rate-based measure for non-motorised user casualties
5.77 In April 2022, government approved National Highways’ request to cease the development of a rate-based measure for non-motorised user casualties. This was due to difficulties in gathering data on non-motorised miles travelled on the SRN.